
Yesterday, I gave some preliminary results from further testing of the performance of Efficiency (E or Icestorm) cores in original M1 and new M1 Pro chips, in which I showed how the M1 Pro’s two E cores can match the performance of the four of an original M1. This article provides more detailed evidence to support that claim.
It relies on an earlier series of five articles, which provide AsmAttic, the testing app that I use, and explain my rationale and previous results. I won’t repeat them here, but refer you to:
How can you compare the performance of M1 chips? 2 Core allocation
Comparing performance of M1 chips: 3 P and E
Comparing performance of M1 chips: 4 Icestorm
Do M1 Pro and Max CPUs run slower on battery?
Anomalies in base performance of M1 cores
On M1 chips 1 + 1 = 4
Methods
The major addition to my methods, based on AsmAttic, is the concurrent use of the powermetrics command tool to obtain detailed information about the cores during testing. Typically, I set the floating-point test up so that each run takes around 10 seconds, start powermetrics logging with the command
sudo powermetrics -i 1000 -o filename.txt -n 10 --show-all
and immediately start the test processes in AsmAttic. This generates a series of nine sampled periods of just over a second each (about 1025 ms normally) saved to the text file for further analysis.
powermetrics is highly capable, but comes at the cost that it does alter the system that it’s measuring, imposing a small but significant load on the same cores that you’re measuring. It shouldn’t therefore be used to measure test runs for benchmarking purposes.
Results
In this article, I look at the total power used by core clusters, active residency (as opposed to idle, equating to Activity Monitor’s % CPU) for each core and in total, the frequency of each core and as a total, and a little at instructions retired for each cluster, a measure of throughput. I start with running one process on the E cluster.
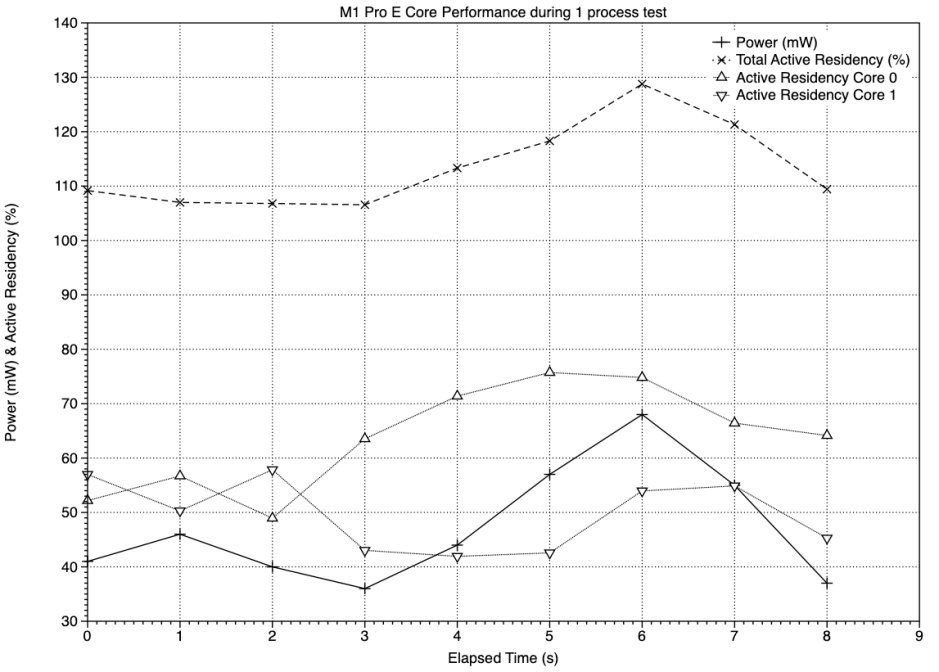
The two charts here cover a period after the start of the test process, and before its completion, during which total active residency (shown with + points on the solid line, above) on the two E cores remained above 100%, in this case on the two E cores of an M1 Pro. This occurred because, during testing, background tasks for iCloud were being run. Power to the E cluster remained between 40-60 mW for much of the period sampled.
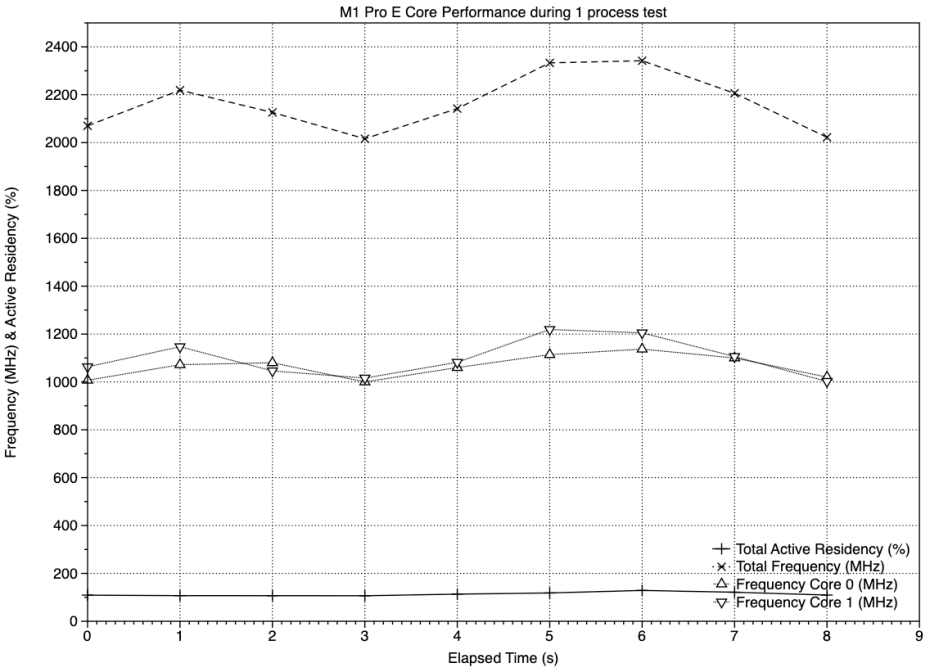
Frequencies of the two E cores varied between 1000-1200 MHz as a result of the load being slightly higher than had been intended. When the same single process was run on the four E cores of an original M1 chip, results were very similar, with a tendency to slightly lower frequencies because of the lighter total load, without the iCloud tasks.
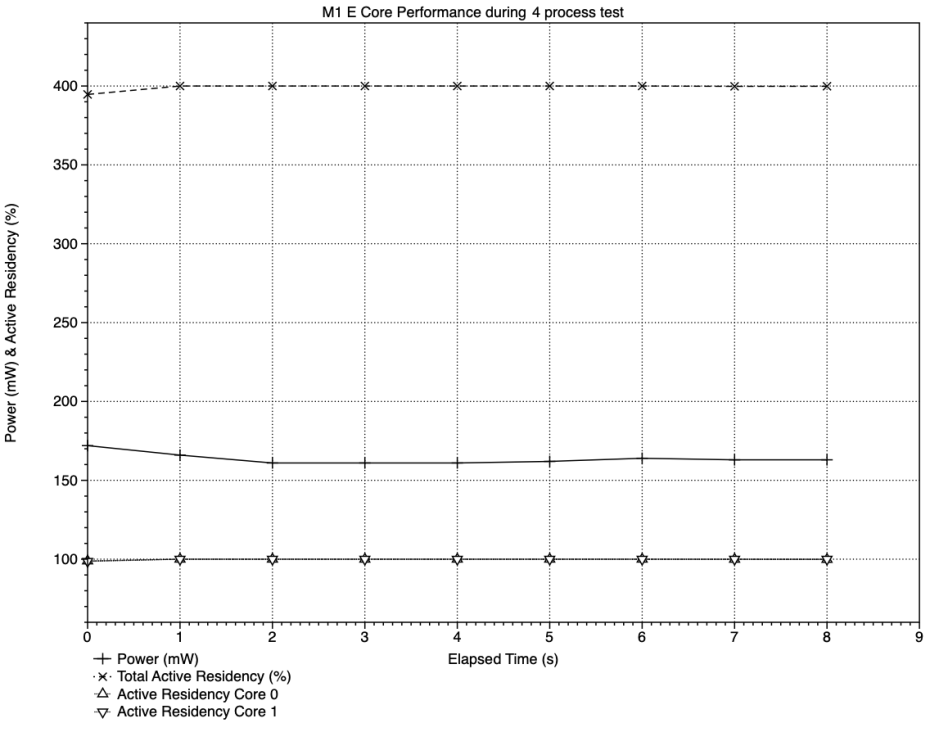
With four test processes running on the original M1, all four cores remained at active residencies of close to 100% throughout the sampling periods, and the power drawn by the cluster ranged between 160-170 mW.
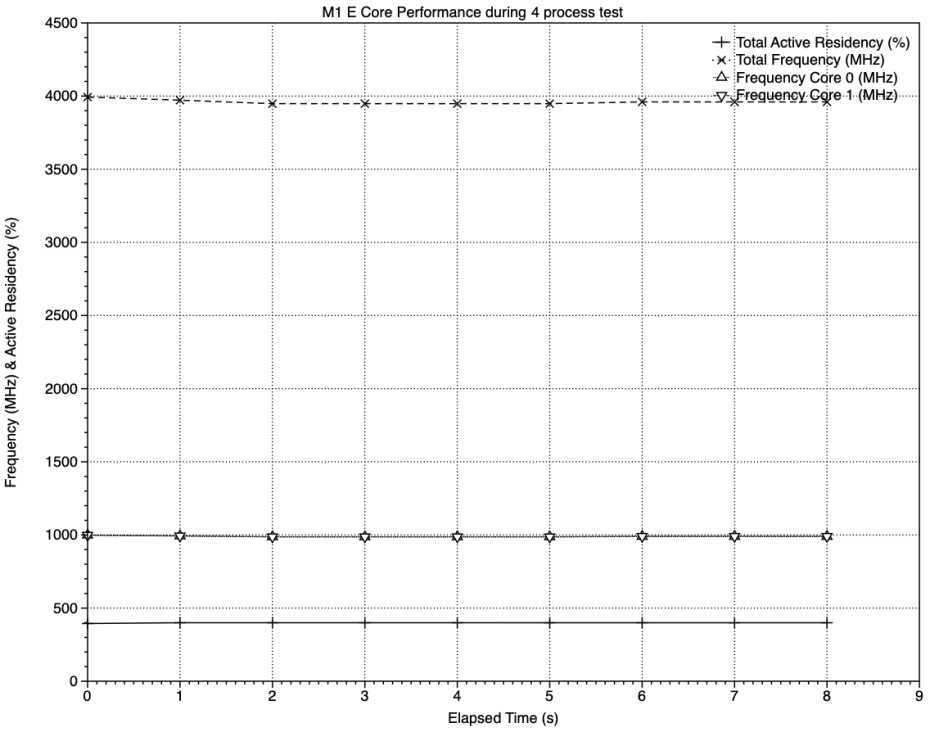
This test wasn’t affected by other background processes, and core frequencies remained close to 1000 MHz throughout, giving a total cluster frequency of just under 4000 MHz.
In those tests, E cores remained at steady frequencies of about 1000 MHz, coping with the additional processes by increasing active residency until it reached 100%. Loading the two E cores in an M1 Pro chip was managed quite differently.
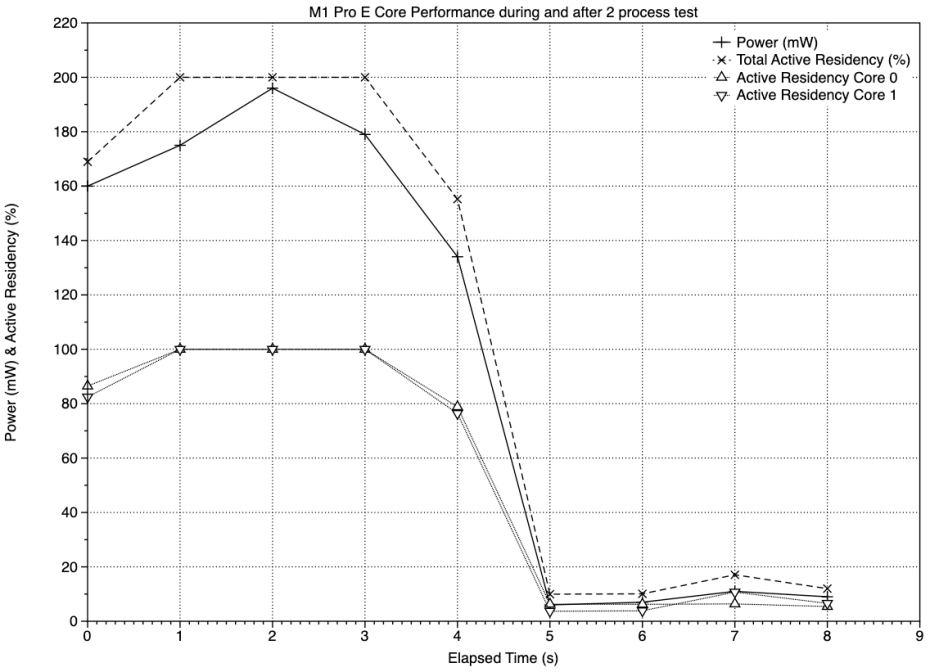
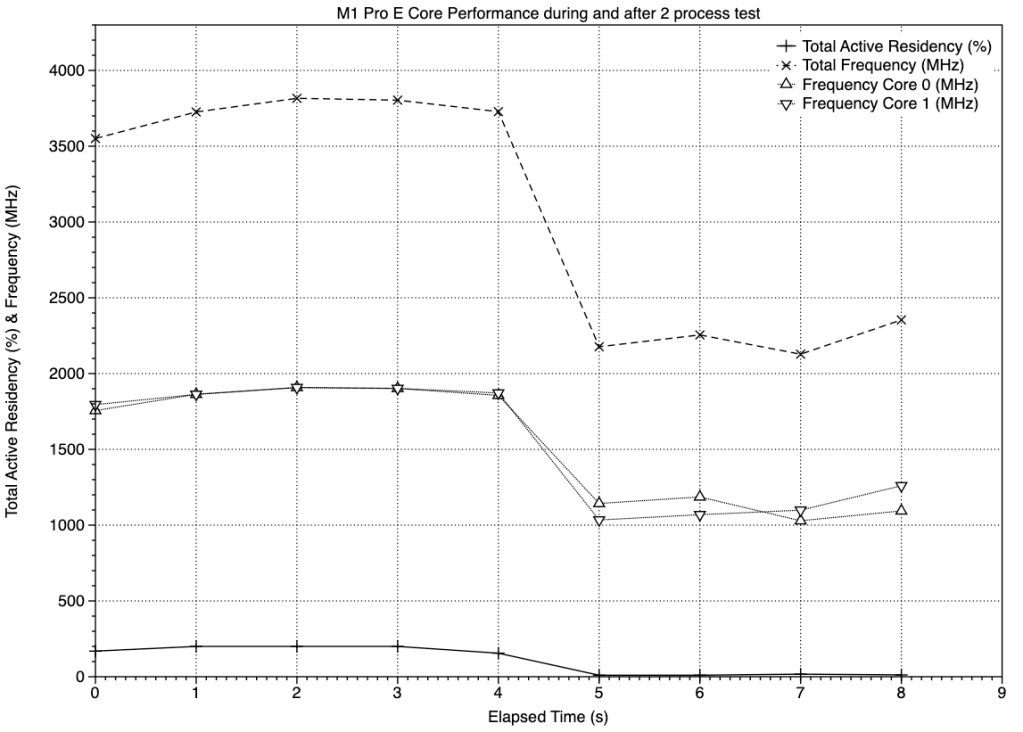
This time, the tests were complete by about half-way through the sampling series. The first set of measurements, at time 0, include some time before the test processes were being run, and the last at load, at 4 seconds, includes some time after the processes had completed, leaving three sampling periods at full load.
In those periods, active residency on each core was 100%, and power consumption peaked at just under 200 mW.

In addition, core frequencies reached 1900 MHz, with a total of 3800 MHz for the pair. Once the test processes were complete, frequencies fell quickly to just over 1000 MHz, for a power consumption of under 10 mW.
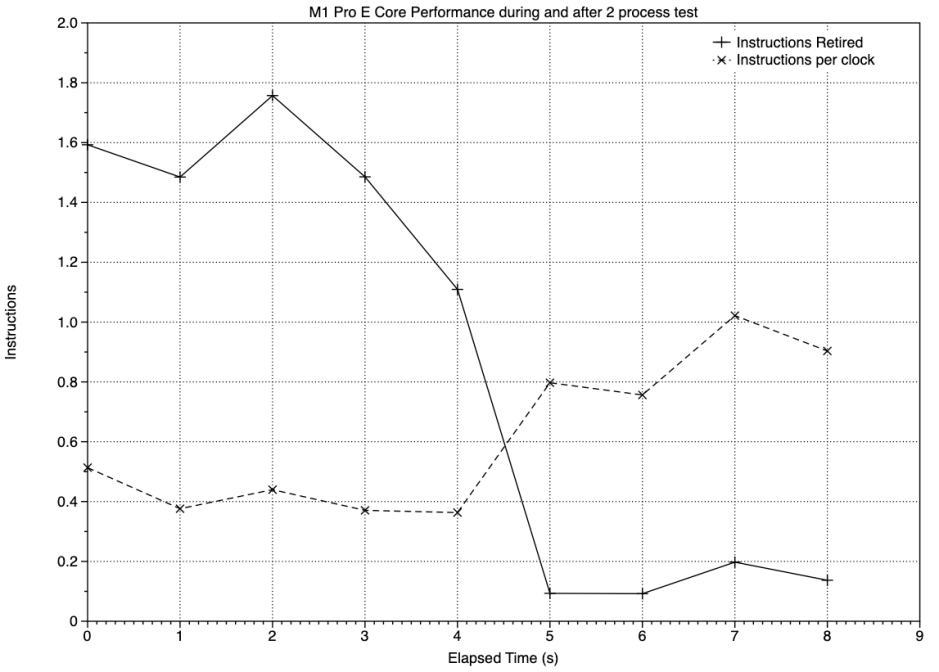
Instructions retired, a measure of those completed, reached a peak of nearly 1.8 x 10^9 over the 1 second sampling period, at which time about 0.4 instructions were being executed per clock. The assembly language source of this test contains 4 floating-point instructions (one of which is a fused multiply-add), one integer instruction, and two branches. Counting each of those to make a total of 7 instructions per loop, that peak thus equates to about 2.6 x 10^8 loops per second, which is close to the measured value of just under 2 x 10^8 loops executed per second (see the chart in this article).
Retirements fell from that peak of just below 1.8 x 10^9 to less than 1 x 10^8 once the test processes had been completed.
My final charts show a different situation in which the two E cores are put under heavy load: when high-QoS processes, which are preferentially run on P cores whenever possible, overrun the P cores available, here when there are 10 processes. As the E cores are here standing in for P cores, you’d expect them to be run as fast as possible.
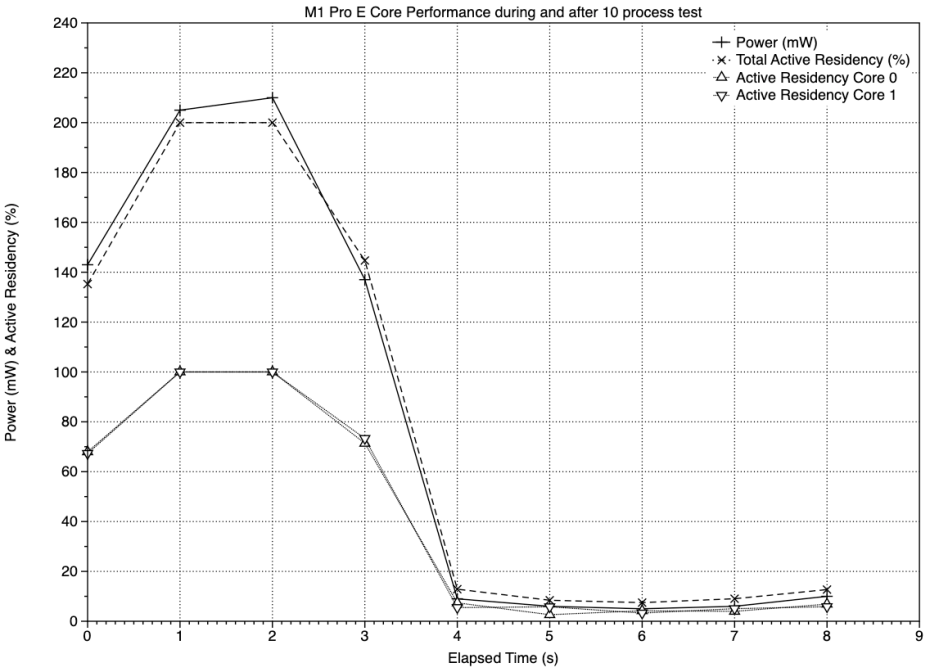
Peak E core performance is even shorter here, and is covered by just 2 sample periods during which active residency was at 100% and power consumption reached almost 210 mW.
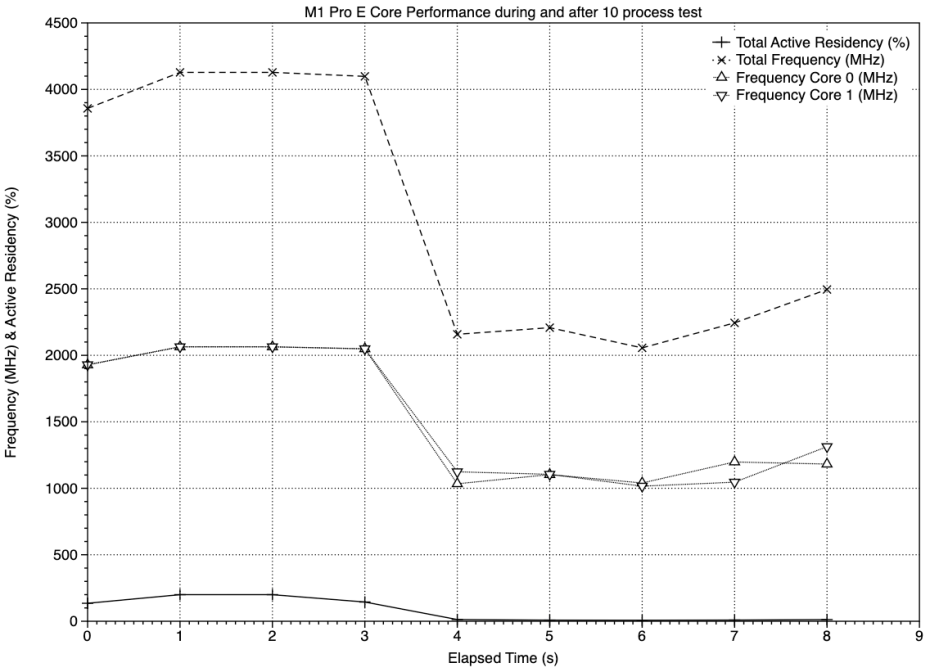
For three sampling periods, both E cores were run at their maximum frequency of 2064 MHz. That compares with both clusters of P cores, which at the time were running at their maximum frequency of 3228 MHz, and consuming about 4 W per cluster, almost 20 times the power consumption of the E cluster (only 2 cores).
Summary of findings and conclusions drawn
- macOS 12.1 manages the four E cores in the original M1 chip, and the two in the new M1 Pro, differently.
- In response to a high load of low QoS processes, frequency of E cores in the original M1 chip remains about 1000 MHz.
- In response to a high load of low QoS processes, frequency of E cores in the M1 Pro is doubled to about 2000 MHz.
- This management policy ensures that demanding background processes with low QoS can complete in similar times on the original M1 and M1 Pro chips. Had M1 Pro chips followed the same policy as the original M1, those processes could have taken twice as long.
- In response to a spillover load of high QoS processes from the P cores, frequency of E cores in the M1 Pro is increased to the maximum of 2064 MHz.
- When running at 100% active residency and maximum frequency, the cluster of 2 E cores in the M1 Pro consumes 210 mW of power.
- When running at 100% active residency and maximum frequency, each cluster of 4 P cores in the M1 Pro consumes 4 W of power.
- Although there’s insufficient evidence here to conclude that all cores within a cluster are run at exactly the same frequency, their frequencies don’t appear to differ by much. Within a cluster, active residencies normally remain broadly similar but aren’t as closely correlated as frequencies.
- In tight loops of predominantly floating-point code, accessing only registers as used here, performance measured by timing correlates closely with that measured by
powermetricsas instructions retired. - The two E cores in an M1 Pro, when at 100% active residency and maximum frequency can outperform a single P core at 100% active residency and maximum frequency, while using one fifth of the power.
