
In the previous article, I considered how using off-the-shelf benchmarks may not provide accurate assessments of the maximum performance of M1 series chips. In this article, I use my testing app AsmAttic to gain more insight into the problems of measuring the performance of these chips. As AsmAttic is still under development, I’m not yet ready to release this version. For those wanting to read the test code used in the work described here, I’ve put the source at the end, in the Appendix.
For the tests discussed here, AsmAttic creates an OperationQueue with a maximum number of concurrent processes set by the user, then adds an Operation for each of that number of processes using OperationQueue.addOperation. Each of those processes is very simple: it obtains the Mach absolute time at the start, runs the test for a set number of loops, then obtains a second time when the test is complete.
Each run is performed at a set QoS (Quality of Service), which is used by macOS to determine how to allocate the processes to cores, which is my main concern in this article. When the QoS is set to the minimum, intended for background services, testing has shown that code is run exclusively on the Efficiency (E) cores; when set to the maximum, it can be run on any of the cores, although the Performance (P) cores are naturally preferred.
Not only do I run these tests on a ‘quiet’ system to measure the time taken by each of the processes and the total elapsed time to complete them all, but I also repeat tests with the CPU History window in Activity Monitor open, to see which cores are loaded by each test. In the screenshots shown of these CPU History windows, time passes from left (oldest) to right (newest) for each of the panels, with red representing system load and green the app load.
The two tests used here are: a tight dot product calculation using 32-bit floating point vector math coded in assembly language, which runs mainly in NEON and uses only registers during the loop code; compiled Swift which is elegant if inefficient, calculating a dot product using mixed floating point and integer operations which is likely to require limited memory access without the vector math of NEON. Being simple and relatively tight code loops, it’s easy to sustain 100% loads on cores using either of these.
All testing is performed using macOS 12.0.1.
Original M1 chip (M1 Mac mini 2020)
When run at a high QoS on an original M1 chip with four P and four E cores, each process is largely allocated to a single core, starting with the P cores.
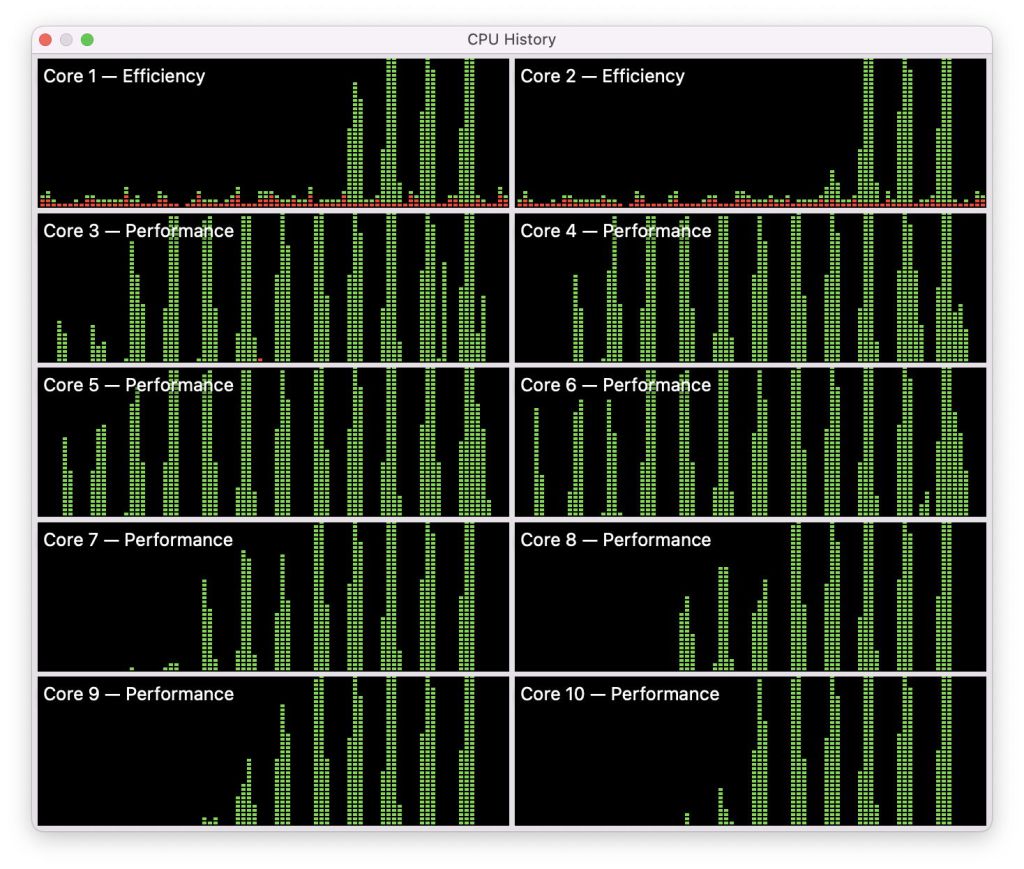
This screenshot shows a series of tests using increasing numbers of processes, from 1 to 8 (left to right in each panel), run at maximum QoS. Core recruitment follows a common pattern:
- One process, core 6 (P), completed in 8 (P).
- Two processes, cores 6 and 7 equally.
- Three processes, cores 5, 6, 8, small contribution from 7.
- Four processes, cores 5, 6, 7, 8, with a small spike in all the E cores.
- Five processes, all four P cores, and core 1 (E).
- Six processes, all four P cores, and cores 1 and 2 (E), with small contributions from 3 and 4.
- Seven processes, all four P cores, cores 1, 2 and 3, with a contribution from 4.
- Eight processes, all four P cores and all four E cores.
Thus, when the app requests maximum QoS, macOS recruits single cores starting with the P cores, until all eight are loaded at 100%. The effect on measured performance follows the same pattern: with increasing numbers of processes each running the same code, overall execution time changes little. However, with more than four processes, when the E cores are recruited, execution time starts to rise because of the lower performance of the E cores. I will provide more detailed evidence of that later, for the M1 Pro.
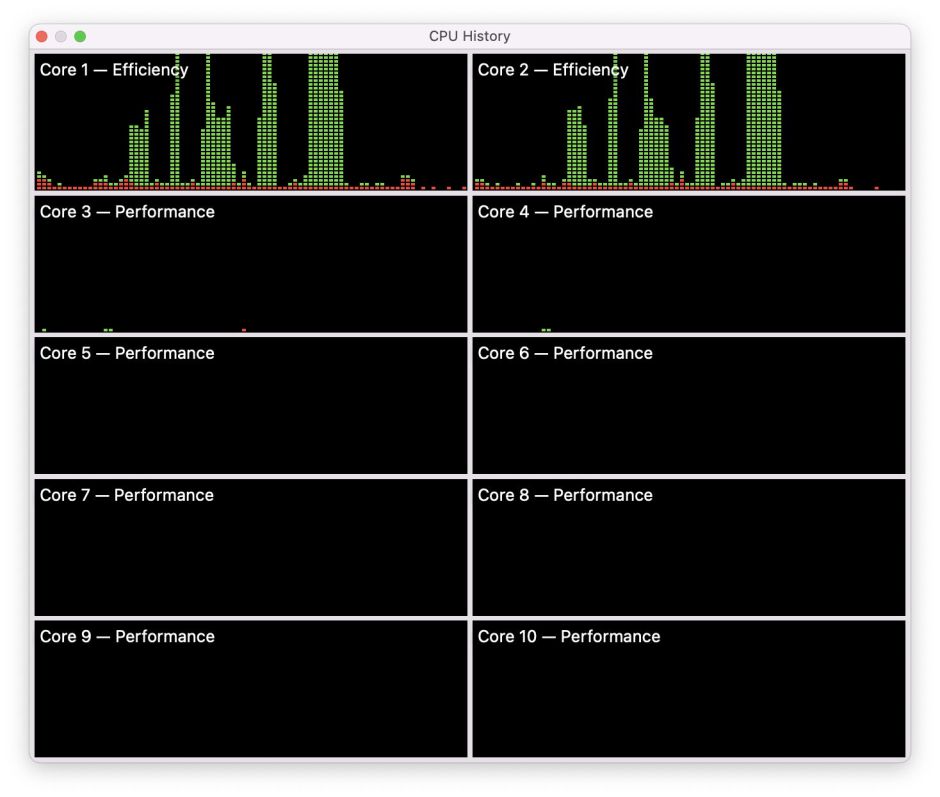
When the same tests are run at minimum QoS, no matter how many processes are passed to macOS, they’re only run on the E cores. In this screenshot, process numbers increase from 1 (left) to 4, 6 and 8. However, unlike the high QoS processes, from the start these are shared fairly equally across all four of the E cores.
M1 Pro chip (M1 Pro 10-core MacBook Pro 2021)
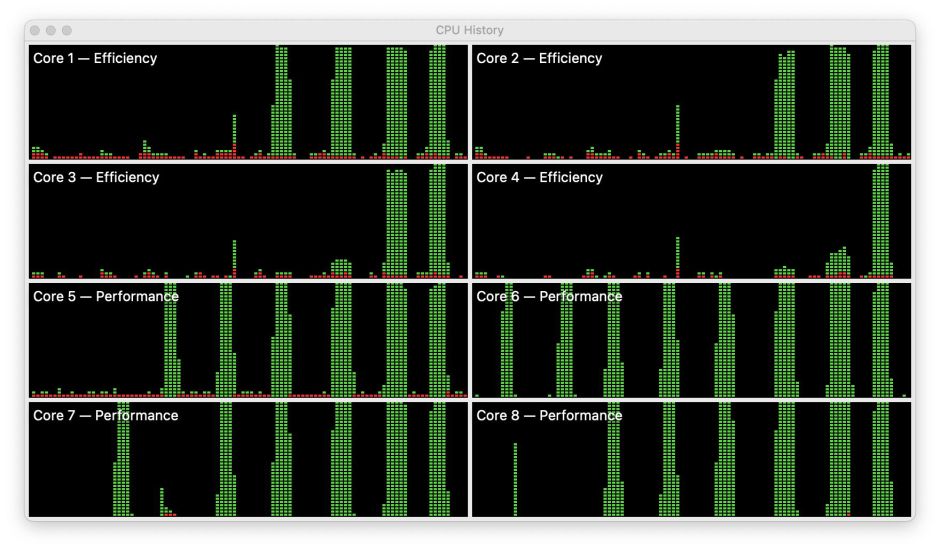
Core recruitment on the M1 Pro is quite different at high QoS. Instead of allocating cores, macOS allocates core clusters, first from cores 3 to 6 (P), then cores 7 to 10 in the second P cluster, and finally the two E cores.

This particular screenshot shows this using the NEON test, but is identical using the Mixed test (used for each of the other screenshots). This is to illustrate that the behaviour seen isn’t the result of any memory access required by the Mixed test, but also occurs when the test only uses registers. From the left, process numbers rise from 1 to 12.
With 3-4 processes, there is minimal activity seen on core 7, in the second P cluster. When the number of processes reaches 9, activity is seen on core 2 (E), and that becomes full use of cores 1 and 2 with 10 processes.
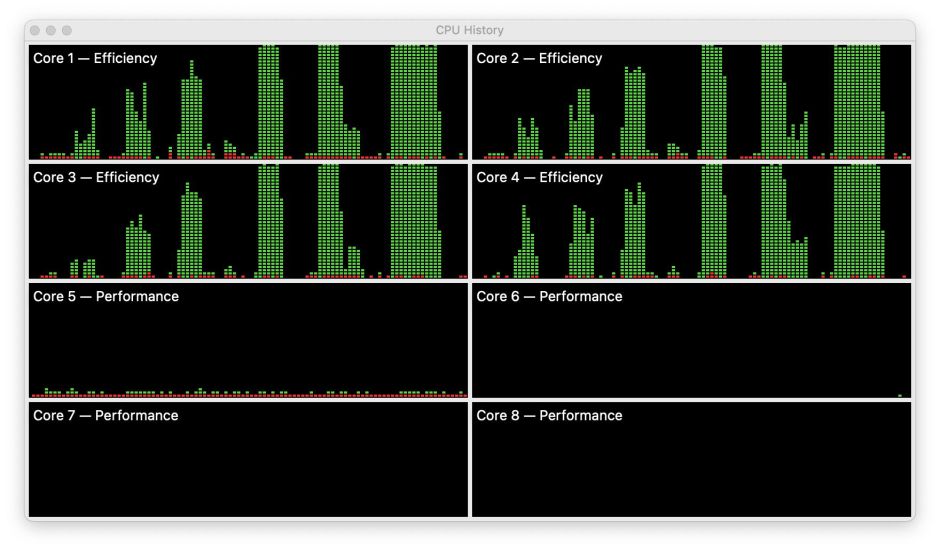
With a minimum QoS, only the E cores are loaded, here with 1, 2, 3, 4 and 8 processes.
Although I’m still working on test timing and performance measurement, I’ll here report some preliminary findings from the M1 Pro tests using NEON. Total elapsed time during testing is largely independent of the number of processes up to a total of eight.
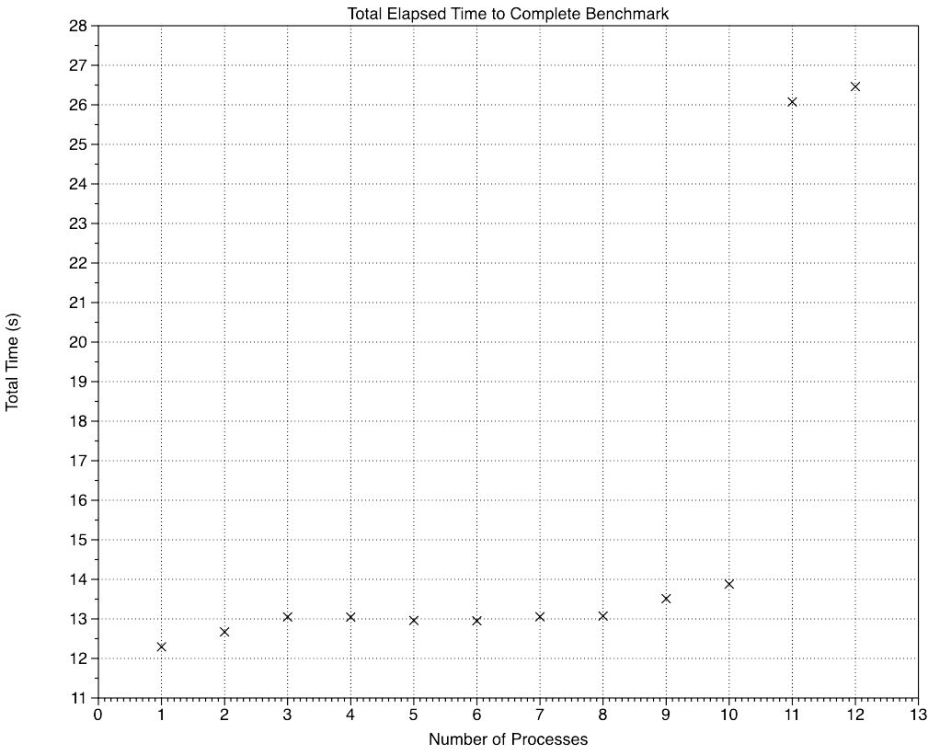
This graph shows how total elapsed time changes with the number of processes. While 1 and 2 processes complete slightly faster, the line remains flat at around 13 seconds until the E cores are recruited with 9 and 10 processes. Because they don’t deliver the same performance as the P cores, those two times are slightly higher. There’s then a step change at 11 and 12 processes, reflecting one or two processes which were run after the first round was complete. macOS scheduled these to run sequentially rather than in parallel.
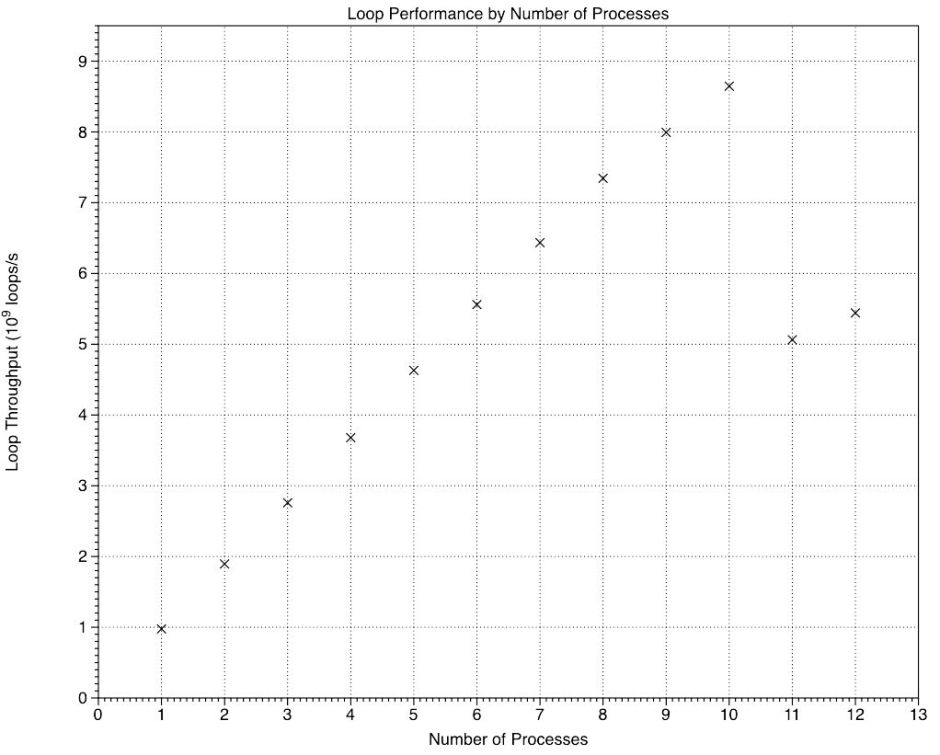
Looked at in terms of the number of loops performed per second, those rose linearly until the E cores were recruited, following which the increments accomplished by the E cores were smaller than those of the P cores, then there was a step reduction for 11 and 12 processes.
The average increment in loop performance achieved by a P core was 0.92 x 10^9 loops per second (range 0.86-0.98), and that for an E core was 0.65 x 10^9 per second (0.65 and 0.65). The performance increment of an E core relative to that of a P core was 0.71, suggesting that in this test involving four NEON vector operations in each loop, each of the two E cores in an M1 Pro chip was delivering about 70% of the performance of a P core, which is higher than I had expected.
Summary
Trying to make performance comparisons between the original 4P+4E M1 chip CPU cores and those of the 8P+2E M1 Pro chip is fraught with difficulty because of their different management policies for core recruitment with different numbers of processes and different QoS.
In the original M1, macOS recruits P and E cores individually per process. However, in the M1 Pro it recruits cores by cluster, first loading cores 3-6 in the first P cluster, then 7-10 in the second P cluster, and finally 1 and 2 in the E cluster.
At minimum QoS, for background services, no P cores are recruited on either M1 chip, and the load is confined to the E cores, where it’s shared fairly equally.
In some respects (at least), performance of an E core in the M1 Pro may attain 70% that of a P core.
Appendix: Source code of the tests discussed above
NEON test
_dotprod:

STR     LR, [SP, #-16]!

LDP     Q2, Q3, [X0]

FADD    V4.4S, V2.4S, V2.4S

MOV     X4, X1

ADD     X4, X4, #1

dp_while_loop:

SUBS    X4, X4, #1

B.EQ    dp_while_done

FMUL    V1.4S, V2.4S, V3.4S

FADDP   V0.4S, V1.4S, V1.4S

FADDP   V0.4S, V0.4S, V0.4S

FADD    V2.4S, V2.4S, V4.4S

B       dp_while_loop

dp_while_done:

LDR     LR, [SP], #16

RET
Mixed test
func runSwiftTest(theA: Float, theB: Float, theReps: Int) -> Float {

var tempA: Float = theA

var vA = [theA, theA, theA, theA]

let vB = [theB, theB, theB, theB]

let vC = vA.map { $0 * 2.0 }

for _ in 1...theReps {

tempA = zip(vA, vB).map(*).reduce(0, +)

for (index, value) in vA.enumerated() {

vA[index] = value + vC[index]

} }

return tempA

}
