
In my explorations of how macOS manages processes to be run on the cores of M1 chips, I have so far concentrated entirely on small numbers of processes, which have always been less than the number of cores in the chip. In many circumstances, this is unlikely, so in this article I report results from running 10-70 processes on original M1 and M1 Pro chips, and the insights they add to understanding how macOS manages processes on M1 cores.
Methods
The two test systems are an M1 Mac mini and an M1 Pro MacBook Pro, both running Monterey version 12.1. The tools used were my test utility AsmAttic version 4.5 (see Resources below), the powermetrics command tool, and Activity Monitor’s CPU History window.
For this series of tests, AsmAttic was set to run processes consisting of 100 million tight computational loops, ranging in number from 10-70 processes in total, using the floating-point test, at minimum Quality of Service (QoS 9) and maximum QoS (33). Each test was performed three times: first to verify the load distribution using Activity Monitor’s CPU History window, then alone to obtain total elapsed time for each test, and finally with powermetrics sampling to obtain active residency, frequency, and power measurements during each test. The complete set of tests was run on each of the two Macs.
It’s important to understand that the test used isn’t intended to be ‘real world’, but runs entirely in the core using only its registers, and makes no memory access. This is to eliminate the many other factors which come into play in normal benchmark testing, to allow this to focus as much as possible on simple core performance, regardless of caches, instruction reordering, etc.
Results
Unsurprisingly, the more processes that were run, the longer time elapsed to complete each test. These results are summarised in the graph below.
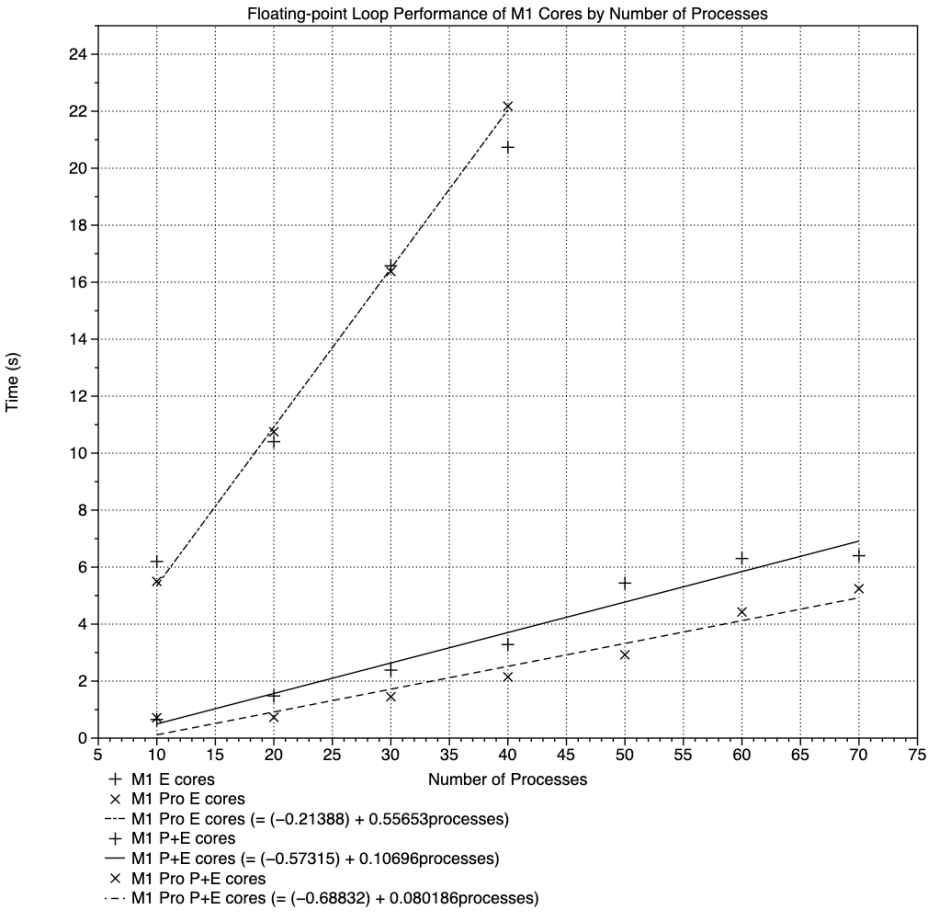
Because this shows elapsed time against the number of processes run, the upper broken line with its + and x points shows the results from low QoS tests, running only on the E cores. These appear to fit a reasonably linear relationship, similar for both M1 chips, despite the fact that the original M1 chip has four E cores, and the M1 Pro only has two.
The reason for this is that, throughout these tests, the four E cores in the original M1 ran at a frequency of 972-1000 MHz, while the two in the M1 Pro ran at 2064 MHz. This is identical behaviour to that I have described before. There was little difference in total E core power consumption, which was around 160 mW in both clusters.
The two regression lines closest to the X axis are those for test times run at high QoS, thus using both P and E cores throughout. The solid line with + points shows performance of the original M1, with 4 P and 4 E cores, and the broken line below with x points is for the M1 Pro, with 8 P and 2 E cores. The performance advantage of the latter is obvious.
During these tests at high QoS, all the P and E cores ran at maximum active residency (100%) and either close to or at their maximum frequency. For example, with 50 processes to run:
- M1 E cores had 100% active residency, 2064 MHz frequency, and used 651 mW
- M1 Pro E cores had 100% active residency at 2064 MHz and used only 206 mW
- M1 P cores had 100% active residency at 3204 MHz and 1400 mW
- M1 Pro P0 (first cluster) cores had 100% active residency at 3228 MHz and 4072 mW
- M1 Pro P1 (second cluster) cores had 100% active residency at 3228 MHz and 4126 mW.
When those results are expressed as loop throughput, in billions (10^9) of loops per second, clear distinctions emerge between the tests and chips.

The performance of the E cores of both chips, shown in the bottom broken line, doesn’t change with increasing numbers of processes, and remains just below 0.2 x 10^9 loops/s, similar to that obtained in previous tests.
Overall performance on both E and P cores, at high QoS, is shown in the two upper curves. Although they start high (with the exception of M1 Pro running 10 processes), they decline steadily to around 1 x 10^9 loops/s for the original M1, and about 1.35 x 10^9 loops/s for the M1 Pro. However, both curves have significant scatter, which is the result of the way in which macOS schedules these processes.
AsmAttic generates the processes in a simple for loop, passing each immediately to macOS for execution, which is then scheduled in batches. For example, when running a total of ten processes on original M1 E cores, the first four (1-4) are loaded and run in rapid succession. macOS doesn’t appear to schedule the fifth until the first of those is complete; because the four processes are all identical and are given identical priority, they complete at about the same time. The next batch of four is then loaded and run, and so on, until all the processes have completed. This is reflected in the time to completion: the first four will all complete after an elapsed time (from the start of the test) of about 2.1 s, processes 5-8 at about 4.1 s, and 9-10 at 6.2 s.
At a low QoS, batch size is four for E cores in the original M1, and two for those in the M1 Pro. At a high QoS, with all the cores available, batches of eight are used on the original M1, and of ten on the M1 Pro.
This affects the results of these tests, as the number of processes in each test wasn’t adjusted to be a multiple of the number in a batch. By chance, the test numbers coincided well with batch sizes for E and E+P cores in the M1 Pro, which work best with multiples of 2 and 10 respectively. But those for the original M1 weren’t as well-fitted, being 4 and 8, and will have increased the dispersion of the results.
Summary of Findings and Conclusions Drawn
- When at minimum QoS, the four E cores in the original M1 chip run processes at a frequency of about 1000 MHz, regardless of the number of processes scheduled to be run on them from a single parent app.
- At a minimum QoS, the two E cores in an M1 Pro chip run at a frequency close to or at their maximum of 2064 MHz. As a result, the E core cluster in the M1 Pro performs similarly to that in the original M1, when running low QoS processes.
- This strategy results in identical power consumption.
- Processes run at maximum QoS are run at core maximum frequency of 2064 MHz (E cores), or 3204/3228 MHz (P cores).
- When it can, macOS loads and runs processes in batches sized according to the number of cores to be used. Thus batch sizes range from two (M1 Pro E cores at low QoS) to ten (M1 Pro P+E cores at high QoS).
- When there’s no contention with other processes, and the processes are identical, those in each batch will complete at about the same time. This can result in performance artefacts, particularly when the total number of processes isn’t an exact multiple of the batch size.
- According to
powermetrics, maximum power consumption of the cluster of four E cores in the original M1 is three times greater than that of the two E cores in the M1 Pro, at the same frequency. Conversely, maximum power consumption of either cluster of four P cores in the M1 Pro is more than twice that of the four P cores in the original M1.
I now have sufficient information to make a first attempt at describing the algorithm by which macOS schedules processes for the cores in M1 chips, at least in this uncontended environment. That’s the goal of my next article.
Resources
AsmAttic version 4.5 is available from here: asmattic45.
Previous articles include:
How can you compare the performance of M1 chips? 2 Core allocation
Comparing performance of M1 chips: 3 P and E
Comparing performance of M1 chips: 4 Icestorm
Do M1 Pro and Max CPUs run slower on battery?
Anomalies in base performance of M1 cores
On M1 chips 1 + 1 = 4
Power, frequency, management: how M1 E cores win
