
Your Mac has a problem, and the only way you’re likely to discover its cause is to look in its log. That might appear intimidating, and it’s all too easy to become frustrated and just give up. This article provides hints to help you find what you’re looking for in the log, using LogUI and other free utilities.
Is the log the right place to look?
The first question to ask is whether what you’re looking for is likely to have been recorded in the log.
Although it’s tempting to hope you can read what was going on just before a kernel panic, in practice you’re unlikely to find any log entries at all immediately prior to a panic. That’s because log entries are first written to a memory buffer before being saved from there to disk; when a panic strikes, entries that haven’t yet been written to disk are likely to be blown away in the restart caused by the panic. The best diagnostic information about a kernel panic is in the panic log. That should be shown within the first minute or so of logging back into your Mac once it has restarted.
Archive or active?
If you think the log will contain the information you’re looking for, then decide whether to make a logarchive and work with that, or to analyse the active log. One simple method of capturing a logarchive is to run a sysdiagnose, as its compressed archive also contains a logarchive in addition to a great deal of other reference information. These options are explained in this article.
When?
The log records new entries at a rate of anything from 500 to 10,000 every second. Whatever you’re looking for, the more precise you can be as to when to start looking, the greater your chances of success. One easy target is the start of the last boot, available for the previous 24 hours from the active log in Mints.

One quirk of this check is that it also includes the time that Mints searched for boot times, in its last line. If you’d prefer to run your own check using LogUI, set the Predicate menu to eventMessage and enter the text
=== system boot
for the last 24 hours, which is 86,400 seconds, or less. Finding those entries over such a long period will take time, during which you’ll see the spinning beachball, but it should get there in the end.
Mints offers several other ready-made log extracts using predicates of value. For instance, if you’re looking for entries during a Time Machine backup, either Mints or T2M2 will provide those. The predicates they use are given in their Help books, ready for you to use in LogUI if you wish.
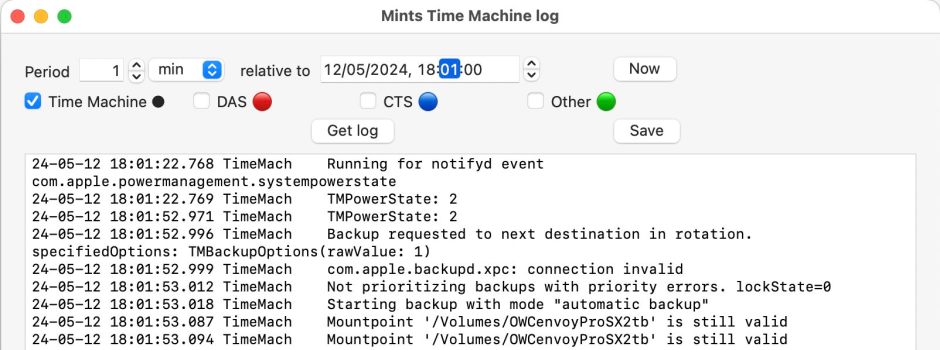
For the last Time Machine backup, its menu will tell you when it completed; set a time a little while before that and a duration of 60 seconds or so, and turn off all the entries (DAS, CTS and Other) apart from those from Time Machine itself.
Use predicates
The traditional way to restrict the entries fetched from and shown in a log extract is using a predicate to filter them. Their drawback is that you must know the right predicate to use, as no other log entries will be fetched or shown, no matter how close they might come to satisfying the predicate. Used wisely, the right predicate can narrow a log excerpt down from over 100,000 entries to just the one you want.
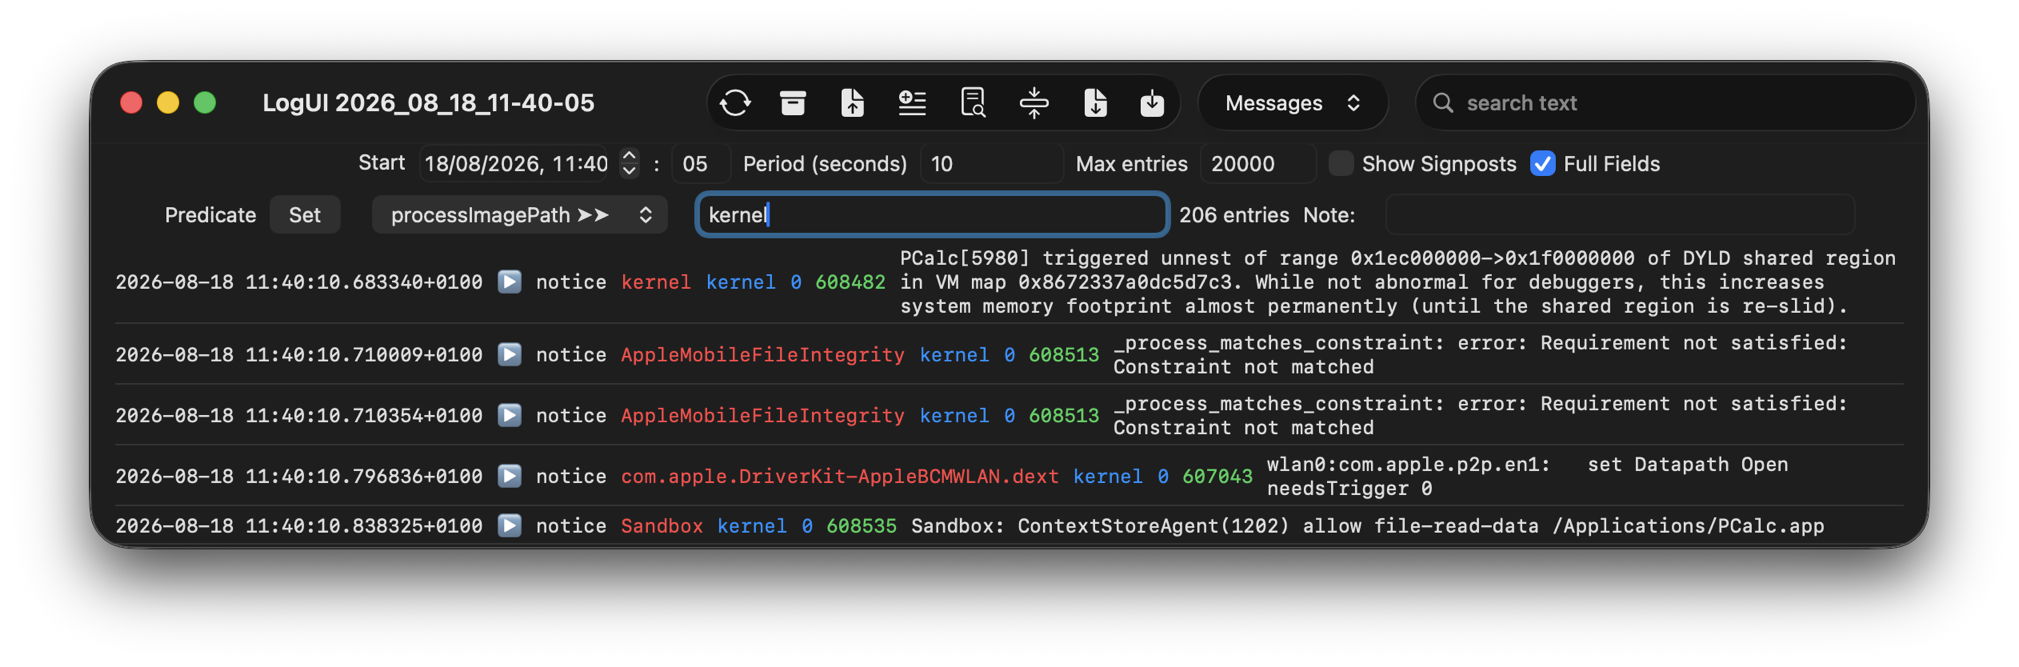
The simplest way to set and use predicates in LogUI is using the popup menu to the right of the word Predicate in its lower settings bar. Here it’s set to get log entries with only the processImagePath of kernel, in other words, entries with the kernel shown in blue.
Over a period of 10 seconds, that returns just 206 entries, whereas without that predicate there would be over 7,000 entries in the extract for same period.
Search
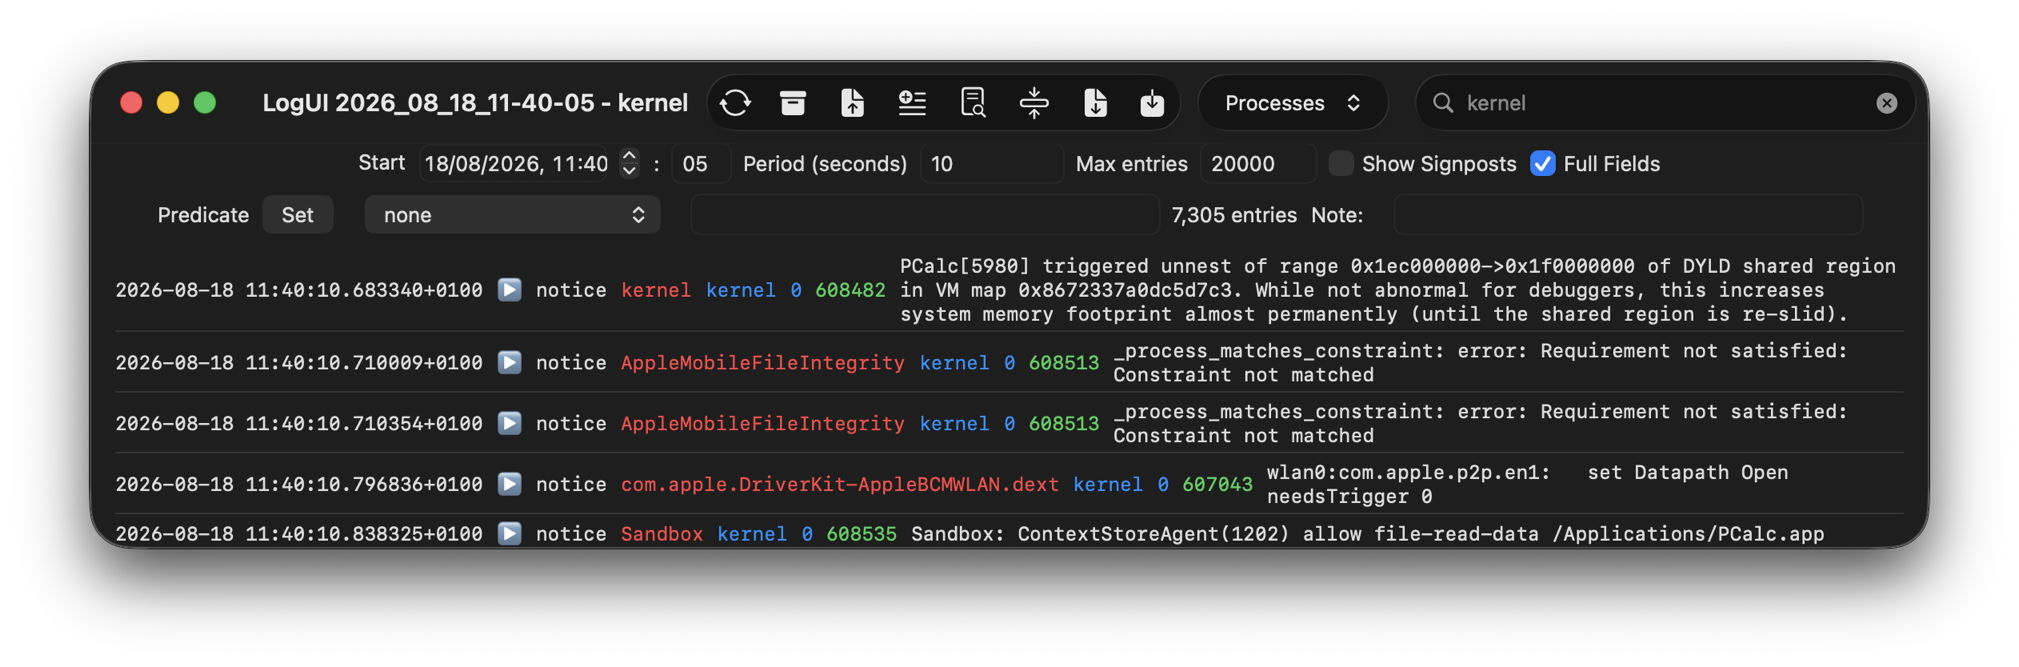
LogUI’s Search feature is a more interactive alternative. No predicate was used to limit entries in this extract, instead search at the right end of the toolbar was set to show only those with Processes containing the characters kernel. Although all 7,305 entries were obtained from the log, only the 206 from the kernel are shown. If you then want to revert to seeing the whole extract again, simply clear the contents of the search box and press Return. To undo a predicate you need to set the Predicate menu back to none and get a fresh log extract.
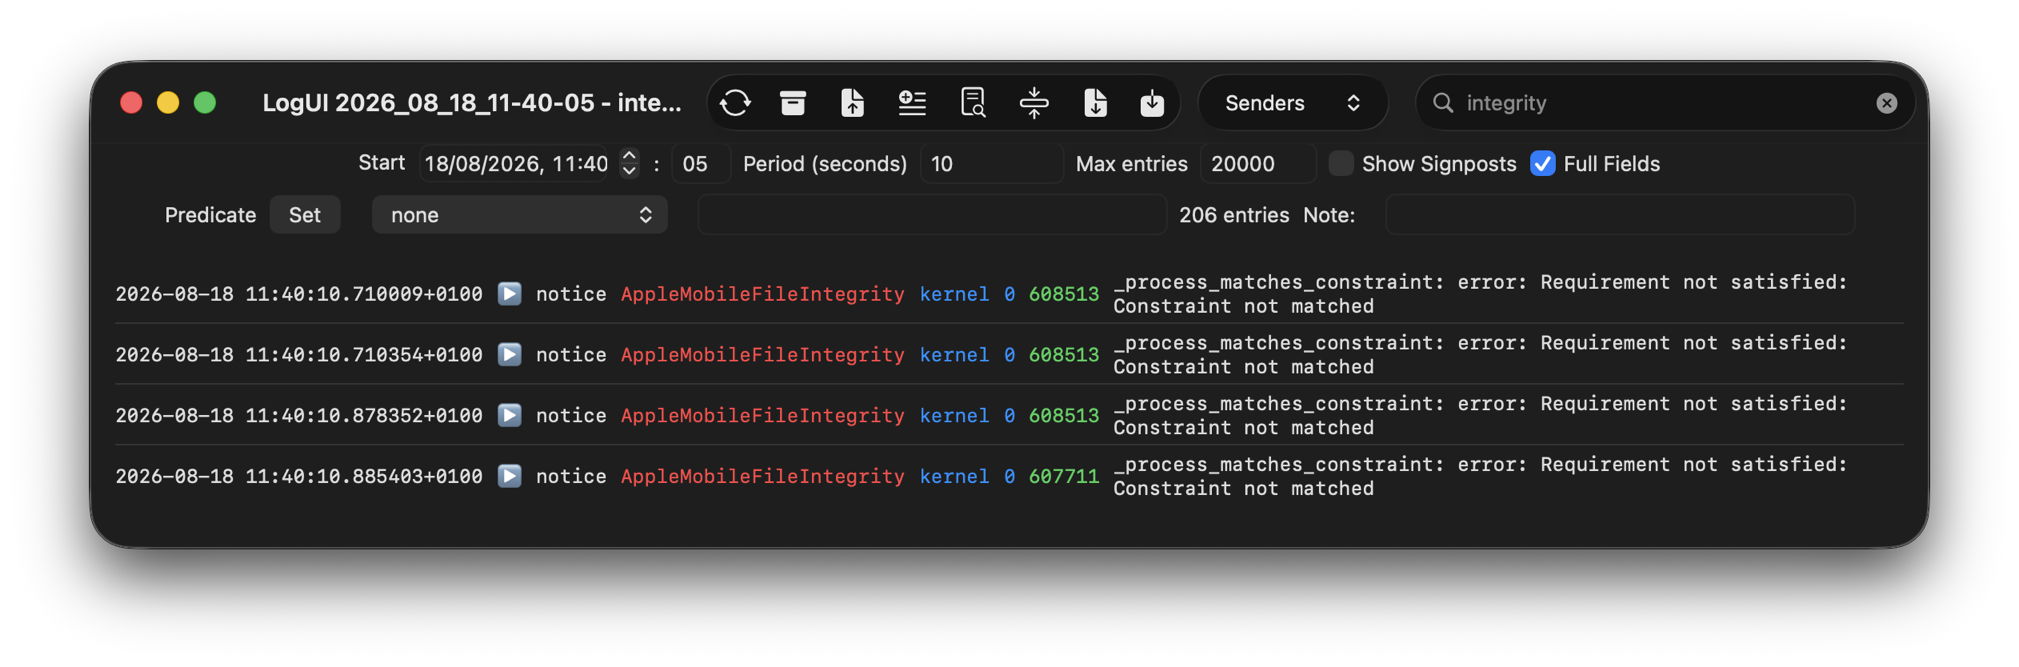
You can apply searches repeatedly, to display those entries with process names containing kernel and with senders containing integrity, as in AppleMobileFileIntegrity. To do that, apply the first search, resulting in 206 entries, then click on the Reduce tool.
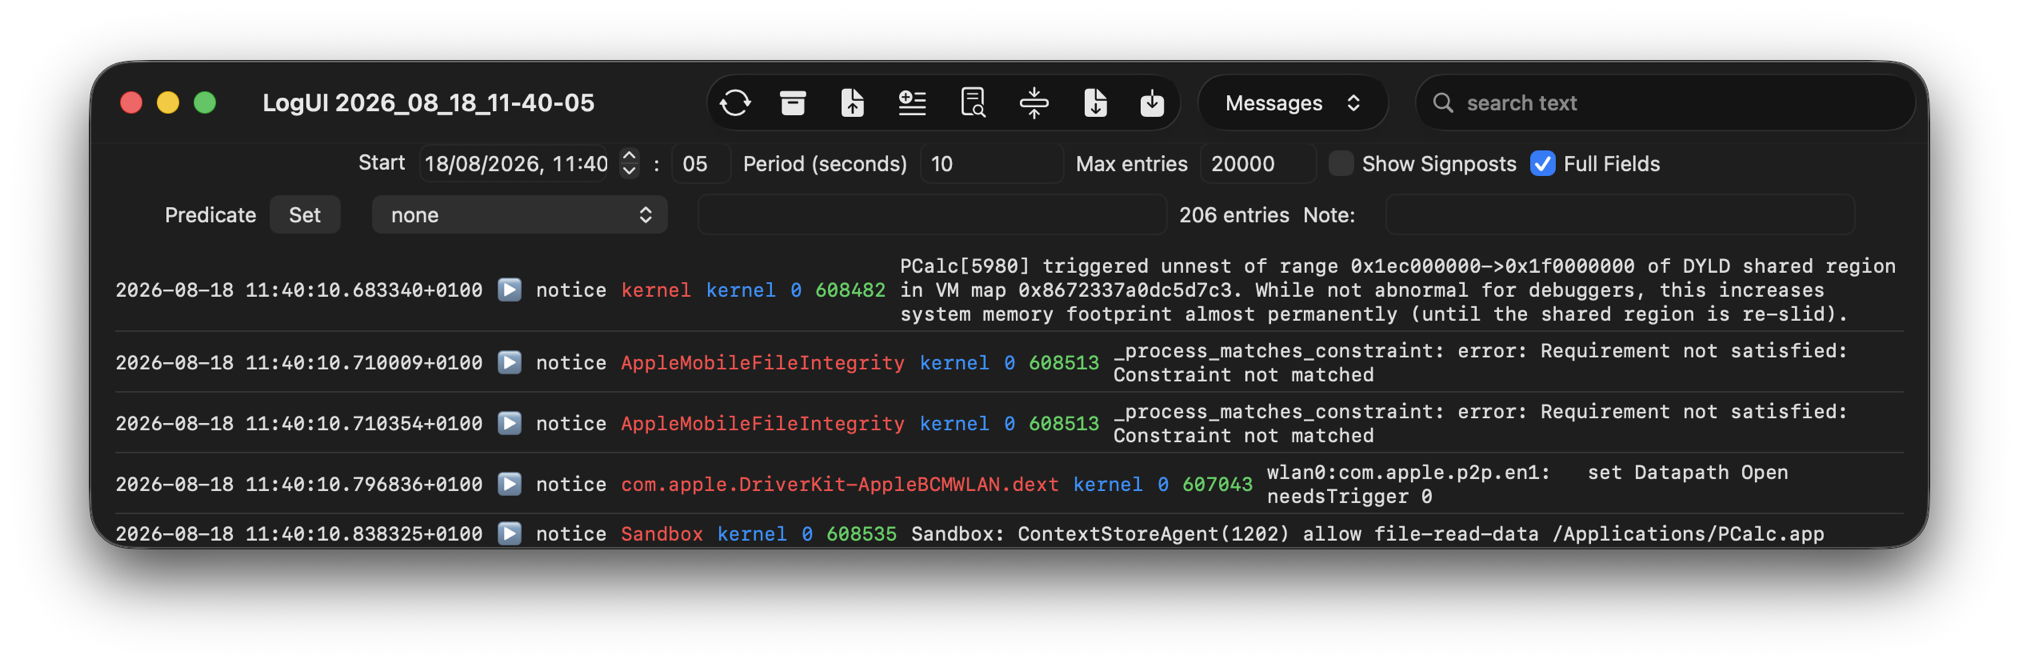
That eliminates all the other log entries, leaving just those found in that search. Then apply the second search, for Senders containing integrity. The only entries shown will be those that both come from the kernel (blue) and concern AppleMobileFileIntegrity (red).
Filter with notes
Predicates and search are powerful ways to focus on relatively small selections of log entries, but they’re limited to simple combinations of criteria. What if you wanted some entries from the kernel and others from LaunchServices? LogUI makes that easy by adding notes to the log entries you want to gather together.
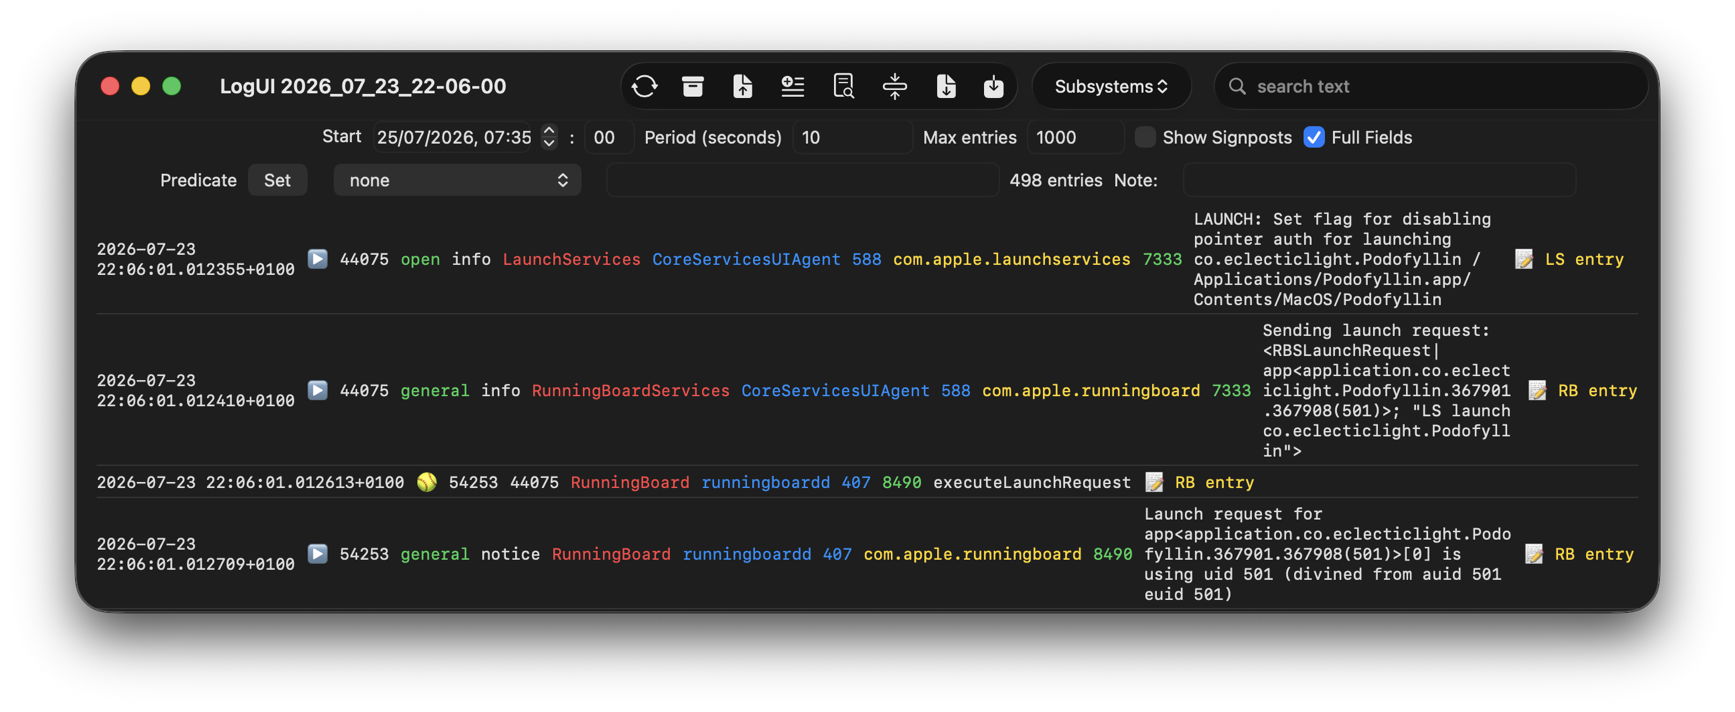
I have demonstrated how to use this feature in this article.
Stepping time windows
There are occasions when you need to look through substantial periods of time, possibly even minutes, which could include hundreds of thousands of log entries. One way of coping with this is to step through the log using narrow time periods of up to 5 seconds, and Max entries set to a high number, over 10,000. Set the Period to around 5 seconds and get the first log extract for that. If you can’t find what you’re looking for there, step the time forward 5 seconds and try again.
You can also use this in combination with a predicate and a larger time interval, with the aim of each log excerpt containing no more than about 5,000 entries.
No log entries
For a few, the problem with the log isn’t an excess of entries, but very few or none at all. If you can’t seem to get anything to appear in a log excerpt, then LogUI’s Diagnostics Tool can check the presence of log files on your Mac, and give you a good idea of how far they go back in time.
Open this using its command in the Window menu, then click on its Get Info tool and open the folder at /private/var/db/diagnostics.
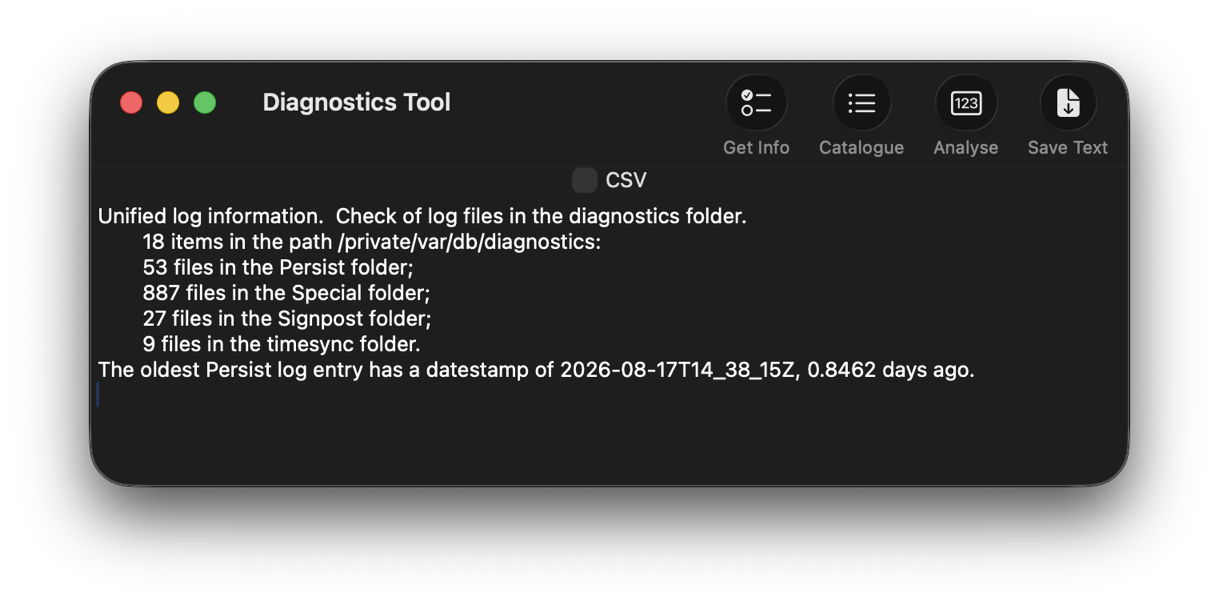
You should then see that there are at least 50 log files in the Persist folder, and the date and time of the oldest log entry.
Summary
- Are you looking in the right place? Is the log likely to have the entries you need?
- Kernel panics are best diagnosed from a panic log.
- Should you work with an archive, or using the active log?
- What time should you start from?
- Use predicates to fetch and display specific entries.
- Use search to interactively narrow down those entries that are displayed.
- Use notes to gather together entries from different processes and subsystems.
- If necessary, step through short sections of time, such as 5 second intervals.
Further reading
LogUI includes a detailed Help book, accessed through its Help menu
LogUI and other log utilities
Mints
Why can’t my Mac get log entries or find XProtect scans?
How long does the log keep entries?
How does macOS keep its log?
Inside the Unified Log 1: Goals and architecture
Inside the Unified Log 2: Why browse the log?
Inside the Unified Log 3: Log storage and attrition
Inside the Unified Log 4: Log entries
Inside the Unified Log 5: Navigation
Inside the Unified Log 6: Difficult times
Inside the Unified Log 7: Claude diagnoses the log
Inside the Unified Log 8: Find the error

