
Your Mac has a problem, whether it has been restarting of its own accord, or something isn’t working as it should. In many cases, the only way you’re likely to discover the cause is to look in its log. That might appear intimidating, and it’s all too easy to become frustrated and just give up. This article gives hints to help you find what you’re looking for in the log, using Ulbow and other free utilities.
Is the log the right place to look?
The first question to ask is whether what you’re looking for is likely to have been recorded in the log. Although it’s tempting to hope you can read what was going on just before a kernel panic, in practice you’re not likely to find any log entries at all in the run-up to a panic. That’s because log entries are first written to a memory buffer before being saved from there to disk; when a panic strikes, entries that haven’t yet been written to disk are almost certain to be blown away in the restart caused by the panic.
The best diagnostic information about a kernel panic is in the panic log. That should be presented to you within the first minute or so of logging back into your Mac once it has restarted. If it isn’t, there currently doesn’t appear to be any way of salvaging that crucial information.
Archive or active?
If you think that the log will contain the information you’re looking for, then decide whether to make a logarchive and work with that, or to analyse the active log. I’ve recently explained the differences to guide you in that choice.
When?
The log records new entries at a rate of anything from 1,000 to 10,000 every second. Whatever you’re looking for, the more precise you can be as to when to start looking, the greater your chances of success. One easy target is the start of the last boot, available for the previous 24 hours from the active log in Mints.

One quirk of this check is that it also includes the time that Mints searched for boot times, in its last line. If you’d prefer to run your own check using Ulbow, then the predicate you need is
eventMessage CONTAINS[c] "=== system boot"
Mints offers several other ready-made log extracts using predicates of value. For instance, if you’re looking for entries during a Time Machine backup, either Mints or T2M2 will provide those. The predicates they use are given in their Help books, ready for you to copy and paste into Ulbow if you wish.
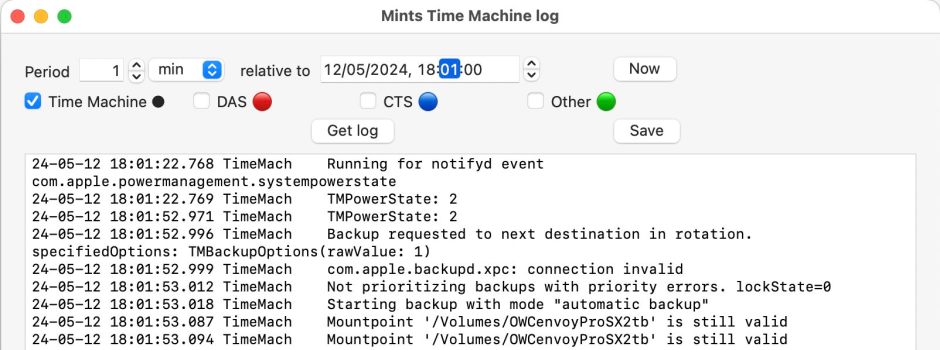
For the last Time Machine backup, its menu will tell you when it completed; set a time a little while before that and a duration of 1 minute or so, and turn off all the entries (DAS, CTS and Other) apart from those from Time Machine itself.
Minimise displayed entries
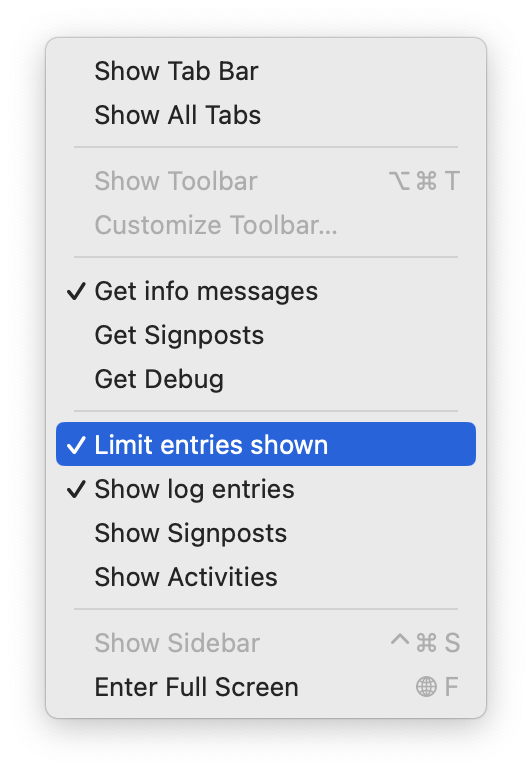
While you’re searching for the right timepoint, minimise the entries obtained and displayed by Ulbow using its View menu. Only get Info messages, not Debug or Signposts. Limit the entries shown in the window, by default to around 1,000, and don’t show Signposts or Activities unless you need them at this stage.
Use predicates
Ulbow uses the log show command to fetch the entries it then tries to display. Key to that command is the use of predicates to filter out unwanted entries. Ask Ulbow to get all entries in the log for a period of several minutes and it will be overwhelmed. Because there’s no straightforward way to determine whether any log excerpt will overwhelm it, at best Ulbow will take a very long time to fetch so many entries, and at worst the task may be so overwhelming that it could crash the log command or Ulbow.
The secret of success is to use predicates coupled with appropriate time periods to limit the entries returned by log show to Ulbow.
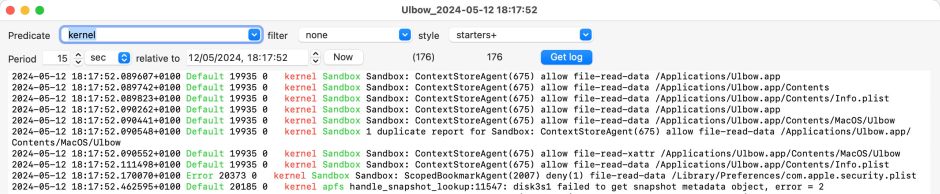
Here I have used a standard predicate to fetch only entries made by the kernel,
processID = 0
Over a fairly brief period of 15 seconds, that returns just 176 entries, whereas without that predicate there would be over 40,000 entries in that same period.
Predicates are passed to the log show command, and work as a filter to reduce the number of log entries it returns. Ulbow’s filters don’t work the same, and only determine which of those thousands of entries are shown.
Stepping time windows
There are occasions when you need to look through substantial periods of time, possibly even minutes, which could include hundreds of thousands of log entries. One way of coping with this is to step through the log using narrow time periods, and Limit log entries shown turned off. Set Ulbow’s period to around 5 seconds, relative to your starting point, and get the first log extract for that period. If you can’t find what you’re looking for there, step the time forward 5 seconds and try again.
You can also use this in combination with a predicate and a larger time interval. You should aim for each log excerpt to be no more than about 5,000 entries.
No log entries
For a few, the problem with the log isn’t an excess of entries, but very few or none at all. If you can’t seem to get anything to appear in a log excerpt, then Mints can check the presence of log files on your Mac, and give you a good idea of how far they go back in time.

Summary
- Are you looking in the right place? Is the log likely to have the entries you need?
- Kernel panics are best diagnosed from a panic log.
- Should you work with an archive, or using the active log?
- What time should you start from?
- Search using minimal displayed entries.
- Use predicates rather than filters.
- Step through short sections of time, such as 5 second intervals.
Further reading
Ulbow and other log utilities
Mints
Log literacy: an essential skill for advanced users
Log literacy: Reducing log entries shown
Log Literacy: Navigation
Log literacy: all about the log
Log literacy: the power of message types, and Ulbow 1.10
Log Literacy: Extending Ulbow with predicates, filters & styles
Log Literacy: Hunting bugs with Ulbow’s Chart View
Log Literacy: How to make and use logarchives
Removing privacy censorship from the log
