
Finding your way around the log is little different from any other form of navigation: you need landmarks and waypoints to recognise where you are. Although there’s nothing like a map to guide you, the good thing about navigating the log is that it’s one-dimensional, with time as its only coordinate.
Time
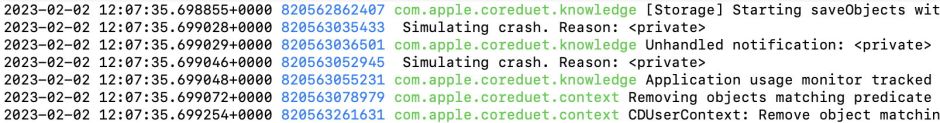
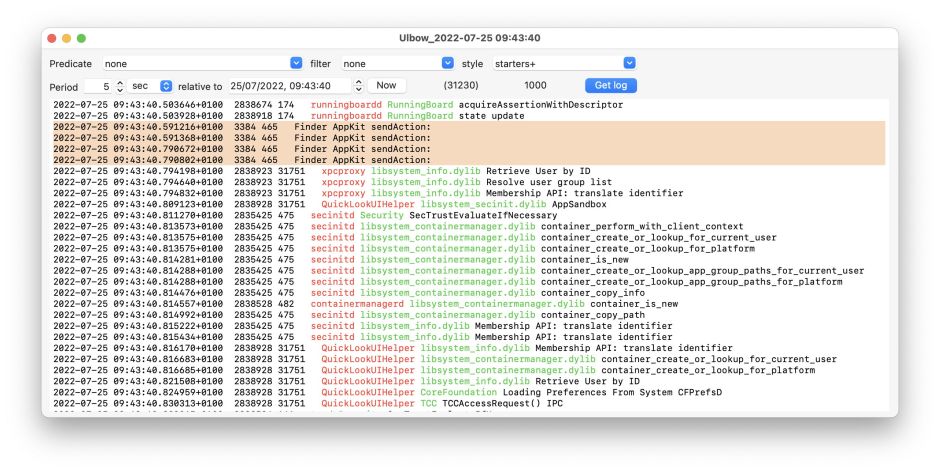
Each entry in the log is accompanied by two timestamps, one in conventional format such as
2023-02-02 12:07:35.698855+0000
the other given in Mach ‘ticks’, usually a huge integer such as 820562862407, as shown in blue above. The latter can be useful when looking at very small time intervals, and I have used it when measuring log performance, but the full timestamp is more generally useful. It’s also worth remembering that Intel and Apple silicon Macs use different durations of tick, with each tick on an Apple silicon Mac equivalent to nearly 42 ticks on an Intel model. If you need to convert between them, when run on an Apple silicon Mac, Mints has a tool for providing the required conversion factor.
One common catch when using the timestamp is timezone correction. In the example given, the timestamp is given in local time after applying the correction given at the end of the timestamp, in this case none. That becomes complicated with large corrections for local time, and when summer time starts and ends. Times entered in Ulbow’s controls are normally expressed in local time, as given in the timestamps recorded in log entries. On the rare occasions when that doesn’t work, you might need to apply a manual correction when entering the time. That should be obvious from the timestamps returned on the log entries.
Rather than requiring you to laboriously set two times to determine the start and end of each log extract, Ulbow uses one time, and you set the period to or from that moment. For instance, if the time is set at
2023-02-02 08:30:00
then a period of -1 minute will obtain log entries between 08:29:00 and 08:30:00, and (+)1 minute for entries between 08:30:00 and 08:31:00.
When you have multiple windows open in Ulbow, it’s simple to copy and paste time settings between them: select any of the items within one time and copy it. You can then paste the whole of that date and time into another window. This doesn’t work with other apps and places, because of weak standardisation in the expression of time.
We often don’t know to the nearest second when an event happened, and browsing the whole log for several minutes will quickly drive you crazy. In those circumstances, it’s better to combine the use of shorter time periods with other methods to reduce the number of log entries shown, such as specifying a subsystem. A simple example is looking at the last hour of log entries from the Time Machine backup subsystem com.apple.TimeMachine, which is likely to return just 50-100 entries in all.
Another useful technique is a sliding time window: to search quickly over a longer interval, use a relatively short period, then work steadily backwards or forwards in time until you think you have a better idea of the exact time of the event.
Boot
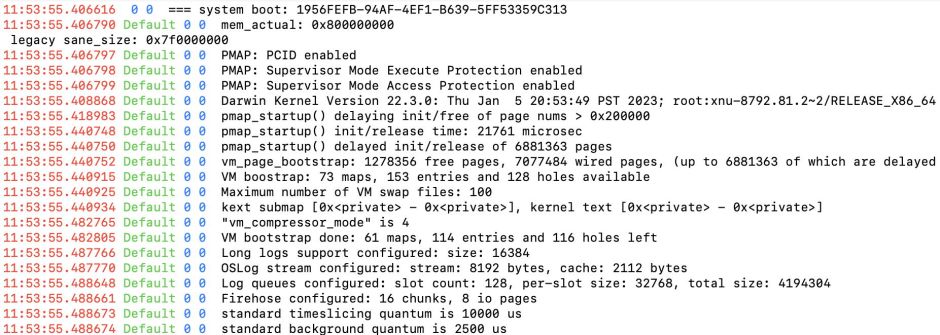
Some major system events have distinctive log entries you can use to discover them. The start of system boot is marked by an entry containing
=== system boot:
followed by the UUID of that boot event. To find that quickly, use Mints.
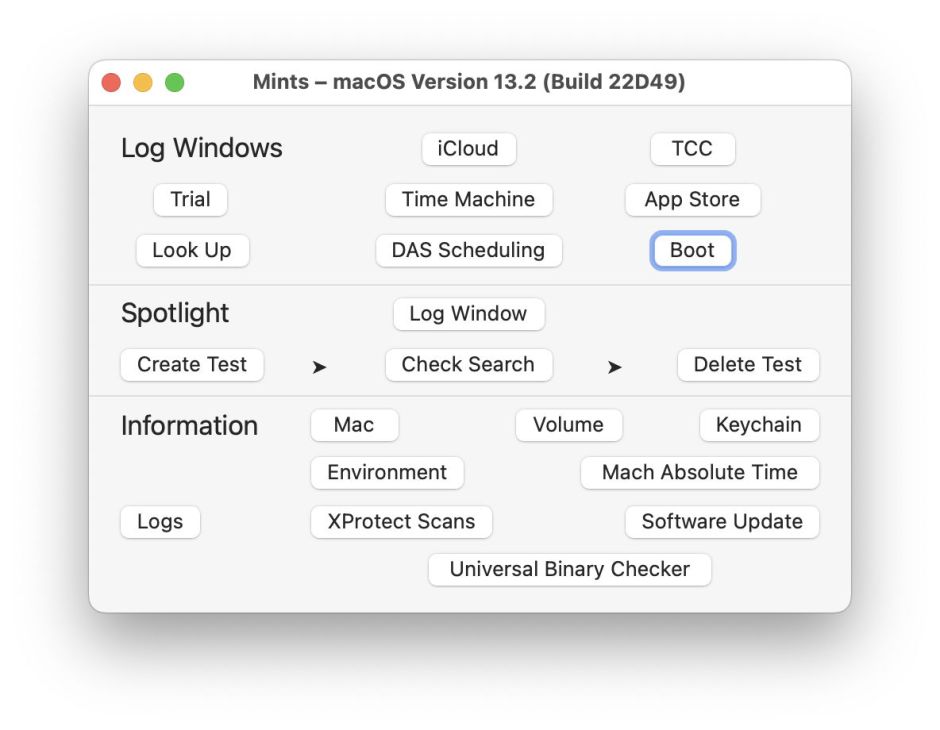
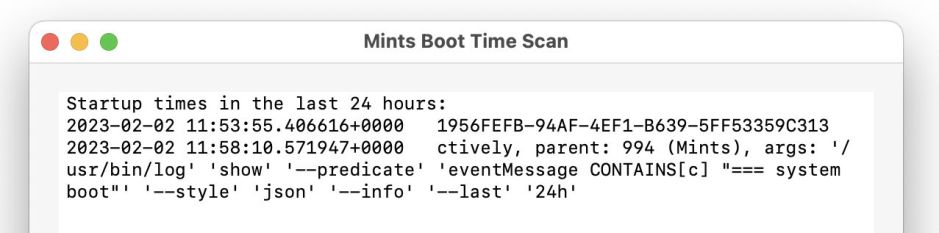
Click on the Boot button among its log windows, and Mints searches for all boot events that occurred in the last 24 hours, returning their times. The last entry in most recent versions of macOS is spurious, and generated when you use this feature, as it also records the moment that Mints started searching for boot events in the log.
Once the kernel has started logging the boot process, entries come thick and fast. Most of the useful information they used to contain about loading of kernel extensions no longer appears in the log because of the fact that macOS now boots from a prebuilt kernel with almost all extensions included.
Shutdown and Wake
Step back in time from a restart and you’ll come across the last log entry before the previous shutdown, normally
=== system wallclock time adjusted
which may accompany other major events too. Prior to that, you’ll encounter numerous SIGKILLs as macOS kills running processes.

When a Mac is woken from sleep, clock time may be adjusted, and you could see
PMRD: System Wake
mark the start of waking. Unfortunately these can change according to macOS version, so are less reliable than other landmarks.
Activities
Some significant events recorded in the log are easy to find, as they’re classified as activities. A common example useful for locating the time that you clicked or double-clicked an item in the Finder is the activity recording that action. This enables you to identify when, for instance, an app or document is opened from the Finder.
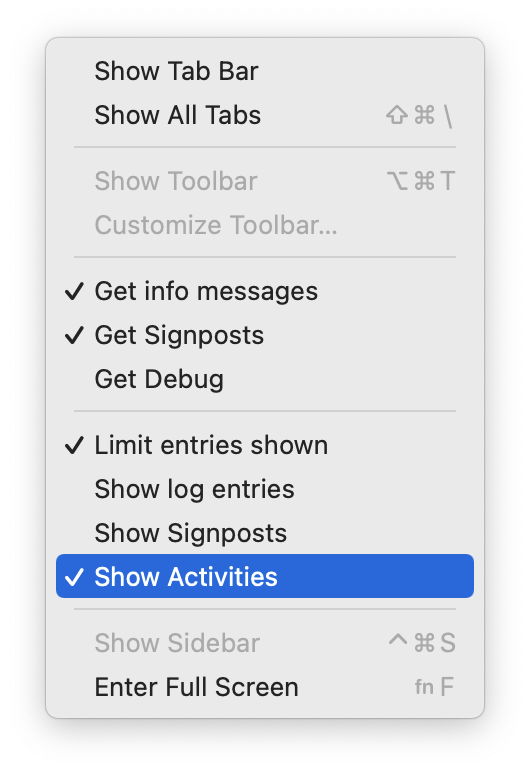
First set the time and period to capture the event. Then in the View menu, tick Show Activities, but untick both Show Log Entries and Show Signposts. Then click on Get log: the extract returned will contain only activities, among them being multiple short entries containing just
Finder AppKit sendAction:
representing click/tap activity. Usually each click/tap results in two identical entries, so a double-click should result in four in total. Once you know the time of those, you can narrow the period to start just before the second of those events. Other activities can also prove useful, and, as activities are far less common than regular log entries, they can make browsing simpler.
Crashes and panics
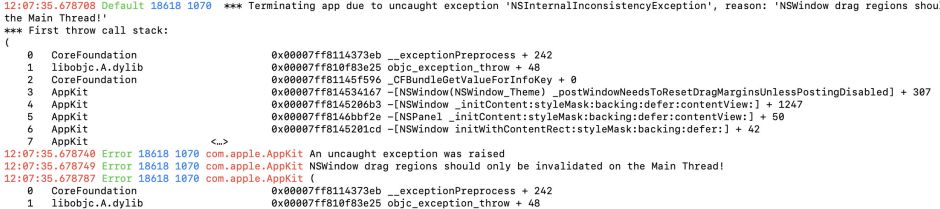
As apps crash for lots of different reasons, log entries recording those crashes also vary. If you can, capture the crash log, which is likely to be in ~/Library/Logs/DiagnosticReports, as that records the time and details of the crash.
Other useful strategies include searching the text content of a log extract for Error, Terminating, or exception, any of which are likely at the time of the crash, or of course the app name.
Kernel panics are less amenable to browsing log entries in search of an account of what went wrong before the Mac restarted. This is because, at the time of the panic, the most important log entries are likely to be held in memory, and not yet written to disk storage. The moment that Mac restarts following the panic, all those log entries are blown away, leaving a long silent gap at the end. That always seems to coincide with the time of the most important events. The best information about a kernel panic is normally saved in its panic log.
In the next article I’ll show how to use Ulbow’s unique chart view as a navigational aid.
Software
Previous articles
Log literacy: an essential skill for advanced users
Log literacy: Reducing log entries shown
