
Since Sierra, macOS has had just the one Unified log. Although there are some specialised logs still available, all regular log entries appear in the Unified log. What isn’t so apparent is that there are three different ways you can access the Unified log, as this article explores. They are:
- the live log, with entries displayed as they’re written to the log;
- the active log, where you browse the entries currently saved in the log, including those made in the recent past;
- an archive copy of the log, where you can browse entries from the log at the time the archive was made.
Depending on which you use, the entries you’ll see will be quite different, so choosing between them is one of the most important steps in browsing the log.
Live log
The easiest way to see log entries as they’re being written is in the Console app, in /Applications/Utilities. As log entries can be written at alarmingly high rates, and will shoot past your eyes, this has severe limitations. But if you’re looking for entries as they happen, it can sometimes be useful. It also has a command tool equivalent in log stream.

If you use either, you’ll almost certainly want to use a predicate to filter the entries displayed, so you don’t have to see entries rushing past quite as quickly. But for most purposes, this isn’t a good way to access the log.
Active log
For this, you need a log browser other than Console, which still doesn’t provide direct access to the log files saved on your Mac. My preference is for my free browser Ulbow, although Consolation 3 also works fine if you prefer its interface. Both rely on the command tool log show to give you free rein over all the entries currently stored in your Mac’s log files.
The logd service actively maintains log files on your Mac. Some are only ever stored in memory and never written to disk; most are saved in log files in the /private/var/db/diagnostics directory on your Mac’s Data volume, then progressively thinned as they age, until after hours or days that log file is empty and is deleted.
Unlike most other log systems, logd doesn’t thin entries to provide logs covering fixed periods of time, but it’s driven largely by the total size of the log files, and designated persistence for entries from different sub-systems. When log entries are written at a high rate, available capacity is filled quickly, and logd starts removing entries after a shorter period. Total period covered fully by the log may then fall to as little as a few hours.
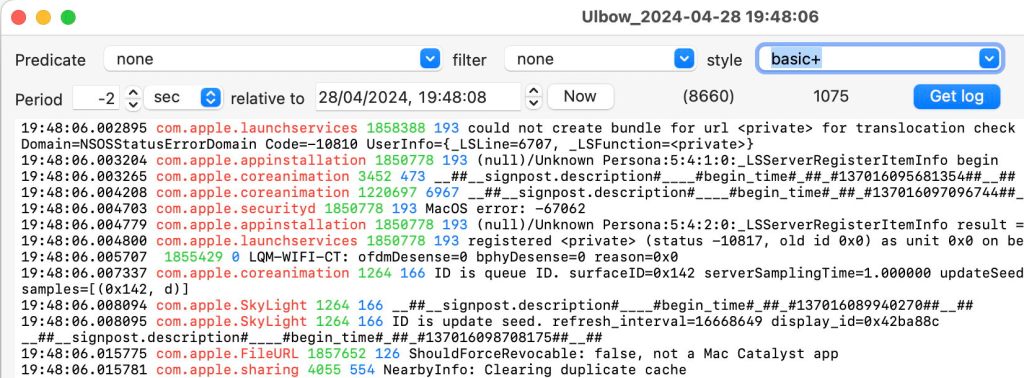
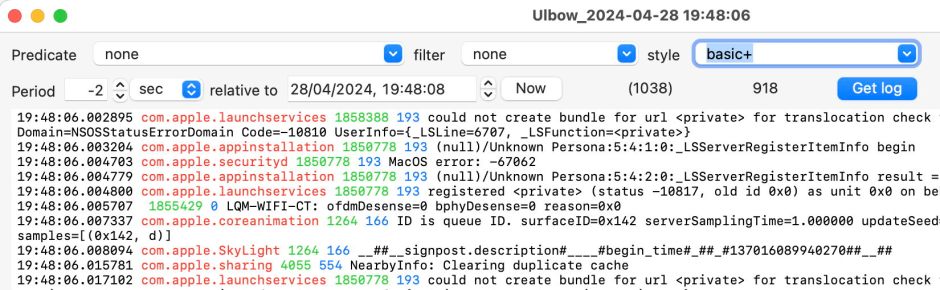
You can see this happening over shorter periods by capturing a couple of seconds of log immediately entries have been recorded, and later capturing exactly the same period of time, as shown below. In one period of 2 seconds, an immediate capture had 8660 entries; 40 minutes later, only 1038 of those remain in the log. This can be quite disorientating, and you may discover the entries you’re most interested in have simply vanished when you try to browse them a little later.

Log archive
To eliminate the effects of logd thinning entries, the best solution is to archive the log into a logarchive bundle that remains stable and won’t change in contents. There are three ways to do that:
- running
sysdiagnoseautomatically creates a logarchive that you can unwrap from its other reports and open for browsing with Console, Ulbow or Consolation 3. - creating a custom logarchive using the
log collectcommand, and opening it using your favourite log browser. An example command might belog collect --output ~/Documents/my.logarchive --last 5mto collect the last 5 minutes of log in the specified logarchive bundle. Unfortunately, the Write logarchive command in Ulbow is currently out of action, awaiting implementation in a privileged helper tool. If you try to save a logarchive to an external volume, don’t be surprised iflog collectrefuses to oblige. - creating a custom logarchive using Ulbow with copies of the log files, as explained next.
Ulbow’s Logarchive Tool
One major disadvantage of creating a logarchive using log collect is that it only works on the active log on the current Mac. You can obtain logarchives from a device using its sysdiagnose facility, but for all other cases, that command tool can’t produce logs that can be browsed on your Mac. For those, try Ulbow’s Logarchive Tool, through that command in its Window menu.

Prepare the log files by creating a new folder and copying two folders from the Mac’s Data volume to it: /private/var/db/diagnostics and /private/var/db/uuidtext. The former contains the log files and their supporting data such as timesync files, while the latter is a collation of supplementary content arranged by UUID. Click on the Make Logarchive button, select the enclosing folder, and Ulbow will do its best to turn those into a logarchive bundle, even on external storage if you wish. You can then Catalogue that, Analyse its contents, and open it for browsing in Ulbow.
To browse those log entries, open a New window in Ulbow, then open the logarchive using that command from the File menu. Once you have made a logarchive, you can also open individual .tracev3 log files within it. The only difficulty with these is discovering an appropriate time to start browsing from. For that, the statistics supplied when you Analyse the logarchive are invaluable.

As Apple has never published a specification for logarchive bundles, this may not work in every case, but in my experience it can even create a usable logarchive when some of the logs are missing.
Summary
- Browse the live log in Console if you want to look for entries as they happen.
- In most cases, it’s better to browse the active log using Ulbow, but avoid leaving it too long or entries will be thinned, and eventually no entries will remain at all.
- To retain as complete a record as possible, create a logarchive bundle, using
sysdiagnose, log collect, or Ulbow’s Logarchive Tool.
