
One common observation about Apple’s new M3 series chips is that they have put more distance between their Pro and Max variants. In both previous families, those two variants have differed most in their GPUs, and their CPUs have been almost identical. As the M3 Max has two six-core P clusters, twice the number of the M3 Pro, those two variants now deliver very different performance and energy efficiency. This article compares performance of CPU P and E cores, to assess how that has changed between the M1 and M3.
Methods
A total of eight different in-core performance tests were used, and an empty loop coded in assembly language to allow overhead from loop execution to be accounted for. Tests were run using threads consisting of 10^6 to 10^9 tight loops, selected for each test to ensure that runs completed in 0.5-15 seconds when run on P cores.
Tests included:
- integer arithmetic (assembly)
- floating-point arithmetic using multiply-add (assembly)
- NEON vector unit calculating a dot-product on two vectors of four 32-bit floating-point numbers (assembly)
- simd_dot, calculating a dot-product on two vectors of four 32-bit floating-point numbers (macOS library)
- CPU matrix multiplication of two 16 x 16 matrices of 32-bit floating-point numbers (Swift)
- vDSP_mmul matrix multiplication of two 16 x 16 matrices of 32-bit floating-point numbers (Accelerate library)
- SparseMultiply, multiplication of dense and sparse matrices of 32-bit floating-point numbers (Sparse Solvers in the Accelerate library)
- BNNSMatMul matrix multiplication of 32-bit floating-point numbers (here in the Accelerate library).
Source code is appended to previous articles (see the links at the end).
On the M3 Pro, P tests were run using 1 and 6 threads at high Quality of Service (QoS), low-frequency E tests using 1 and 6 threads at low QoS, and high-frequency E tests using 6 and 10 threads at high QoS, so the performance of high QoS threads that overflowed onto E cores could be measured. On the M1 Max, P tests used 1 and 8 threads, low-frequency E tests in a single thread at low QoS, and high-frequency E tests in 2 threads at low QoS, because of the way that macOS manages frequency of its two E cores.
Completion times for each test were then used to calculate the time per thread from the gradient between single and multiple thread results. From those, the loop rate per second per thread was calculated. Measured empty loop rate was subtracted from that to give the overall loop rate per second per thread. Finally, all test results are expressed relative to the overall loop rate calculated for that test on the P cores of the M1 Max, which is set at 100% for that specific test.
P cores
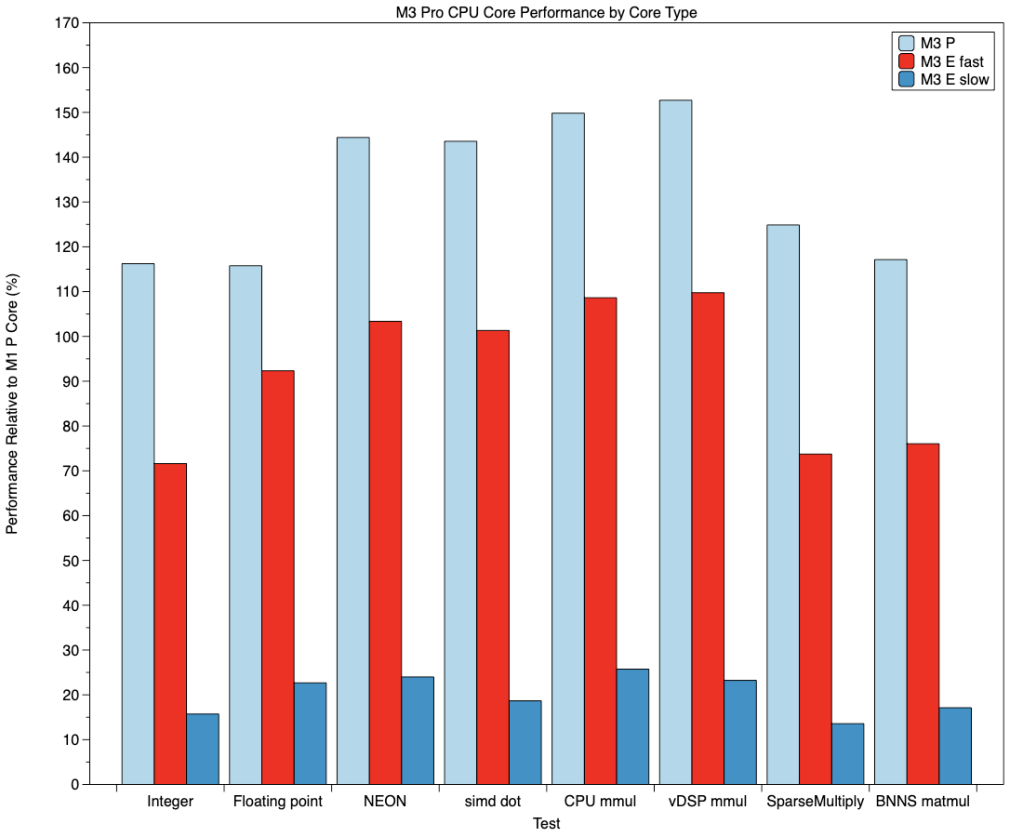
As expected, on every test P core loop rates were higher for M3 than M1, as shown in the chart below.

Greatest differences between M1 and M3 were seen in vector and some matrix computations. Although basic floating-point arithmetic ran at about 115% on the M3, ‘classical’ matrix multiplication was significantly faster at 150%. These confirm previous results showing that scalar integer and floating-point tests improve as expected from frequency differences between the M1 and M3, while vector and matrix tests are further accelerated in the M3. For example, when running a single thread, M1 P cores run up to 3228 MHz, and those of the M3 to 3624 MHz, 112% of the M1.
E cores
When the E cores are running at the low frequency normally used for low QoS background threads, M3 E cores were often significantly slower than those in the M1, as shown in the chart below.
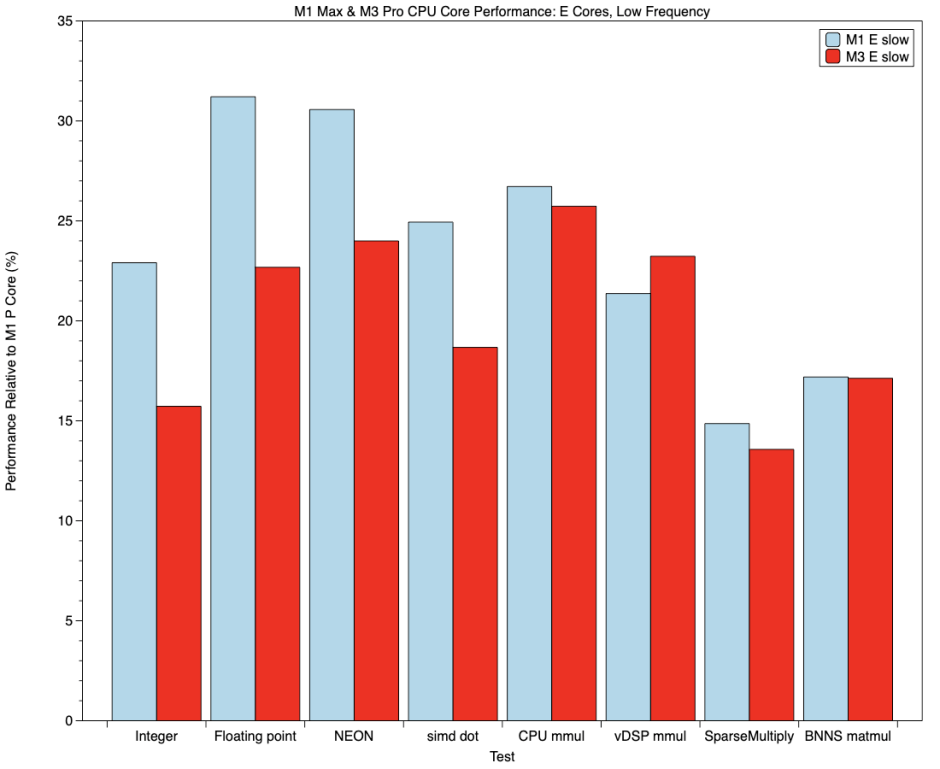
Best performances here was in floating-point and NEON tests on the M1, exceeding 30% of the loop rate of an M1 P core, and significantly faster than M3 E cores. This is to be expected given the difference in frequencies: when running a single low QoS thread, an E core in an M1 was normally run at 972 MHz, while that in an M3 remained at 744 MHz, 77% of the M1.
Running at their maximum frequency, M3 E cores were much faster than those of the M1, and in non-scalar computation achieved loop rates slightly higher than the P core of the M1.

When running at their maximum frequency of 2064 MHz, E cores in the M1 typically delivered 40-60% of the P core loop rate. For M3 E cores, running at their maximum of 2748 MHz, 133% of the M1, those rose to 70-110%. Although that still leaves them behind M3 P cores, for example with integer loops at 62% of the M3 P core rate, those are a considerable improvement above that expected from frequency alone.
Performance profiles
Perhaps the best way to appreciate performance changes in core types is to compare the overall profiles for M1 and M3 cores, as shown in the following two charts.

This chart pools together all loop rates for the M1, and shows how much slower its E cores are even when run at high frequency.

The same measures for the M3 show the wider gap between slow and fast E core performance, with its E cores closer to P core performance when at their maximum frequency. Relative to the M1, M3 E cores are slower and even more energy-efficient when running background threads, but when called on to run high QoS threads deliver performance closer to that of the P cores. Coupled with the larger E core cluster of the M3 Pro, this allows it to deliver better performance for high QoS threads that have overflowed from its single P core cluster, while still remaining efficient in its power consumption. This is a substantial improvement in comparison with both M1 Pro and Max chips, and increases the versatility of the whole CPU.
Conclusions
- M3 P cores are significantly faster than those in the M1 across all in-core performance tests, with greatest improvements in vector and matrix operations.
- When running background threads, M3 E cores are slower than those in the M1.
- When running threads with high QoS, M3 E cores perform almost as well as M1 P cores, and are slightly faster for some non-scalar operations.
- M3 E cores are thus substantially faster than those in the M1 when running high QoS threads that have overflowed from the P core clusters.
- CPUs in the M3 are more versatile than those in the M1.
Previous articles
Evaluating M3 Pro CPU cores: 1 General performance
Evaluating M3 Pro CPU cores: 2 Power and energy
Evaluating M3 Pro CPU cores: 3 Special CPU modes
Evaluating M3 Pro CPU cores: 4 Vector processing in NEON
Evaluating M3 Pro CPU cores: 5 Quest for the AMX
Evaluating the M3 Pro: Summary
Finding and evaluating AMX co-processors in Apple silicon chips
Comparing Accelerate performance on Apple silicon and Intel cores
