
Over the last few weeks, I have published a series of articles here evaluating the performance primarily of the CPU cores in Apple’s new M3 Pro chip. This article is a succinct summary intended to guide those deciding whether to opt for a model with a basic M3, M3 Pro or M3 Max chip.
Previous Apple silicon Macs with M1 and M2 chips have had less distance between their Pro and Max variants. In the M1 series, both come in a 2E + 8P core configuration, and the only substantial difference was in their GPUs, while the M2 versions only increased the number of E not P cores. Both M1 and M2 architectures are based on CPU core cluster size of 4.
CPU cores in the M3 series are clustered in sixes, with the Pro variant having one cluster of E cores and one of P cores. The Max has two six-core P clusters, but a single cluster of just four E cores, a ratio of 3 P cores for each E core, instead of 1 to 1 in the Pro. It thus generates far better multi-core benchmark results, but with roughly double the power use, particularly when its GPU options are taken into account. Striking the right balance between performance and power is thus central to choosing which variant is best suited to different tasks.
M1 and M3
For those upgrading from M1 chips, the first question is whether there’s much difference between CPU cores in the M1 and M3 series.
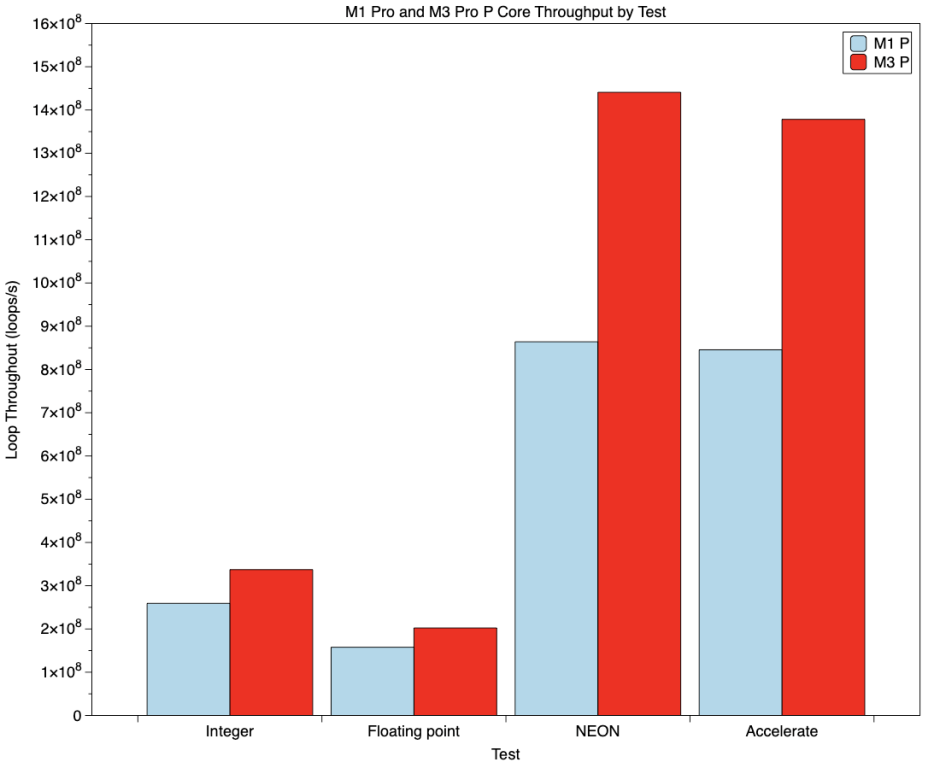
There are substantial differences in performance and efficiency between the CPU cores of M1 Pro/Max and M3 Pro chips. P cores in the M3 Pro consistently deliver better performance than those in the M1 Pro, as shown in the chart above. Red bars showing throughput for the M3 Pro are consistently higher (faster, better) than the light blue bars for the M1 Pro. Performance gains are greater than would be expected from differences in frequency alone, and are greatest in vector processing (NEON and Accelerate tests above), where throughout in the M3 Pro can exceed 160% of that in the M1 Pro. Those gains are achieved with little difference in power use.
E cores in the M3 Pro run significantly slower with background, low QoS threads, and as a result use far less power. When running high QoS threads that have overflowed from P cores, they deliver reasonably good performance relative to P cores, but remain more efficient in their power use.
M3 Pro CPU cores are thus both more performant and more efficient than those in the M1 Pro/Max.
Energy use
For efficiency to translate into battery endurance, it needs to be considered in terms of total energy use.
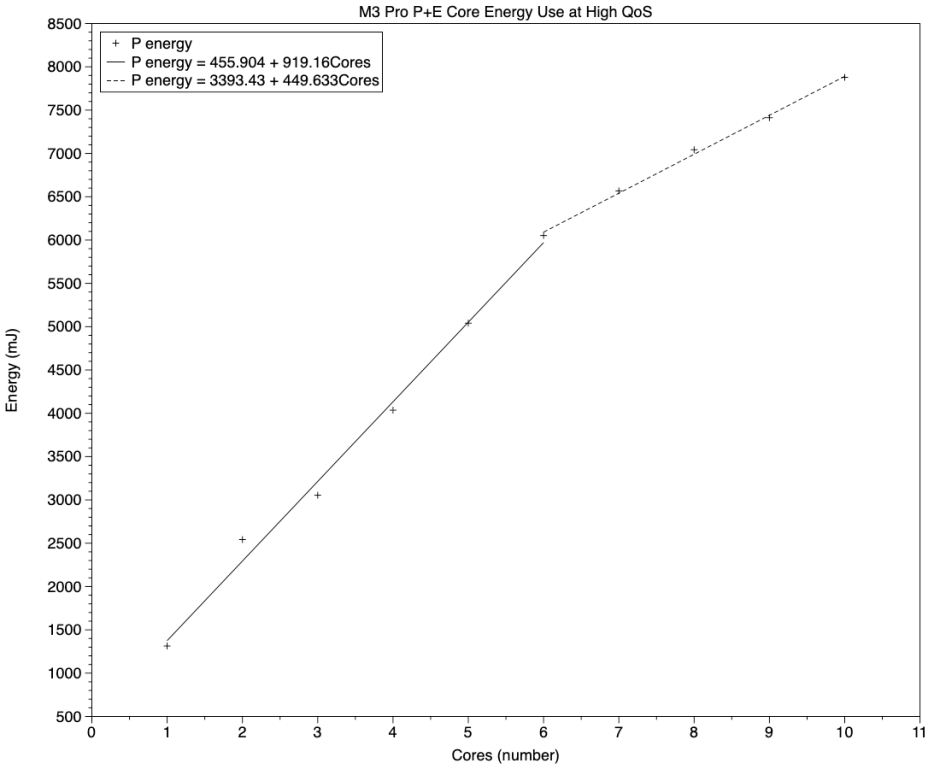
This chart shows total energy use for a standard floating point test, which should hold good for other types of scalar computation performed on CPU cores of an M3 chip. For the purpose of comparison of energy use, the following can be used:
- For low QoS threads run on E cores alone: 60 mJ cluster overhead + 150 mJ per core.
- For high QoS threads run on P cores alone: 450 mJ cluster overhead + 920 mJ per core (solid regression line).
- For high QoS threads that overflow and run on E cores: 450 mJ per core (broken regression line), in addition to P cores.
As a worked example, a heavily loaded M3 Pro might run low QoS threads on two E cores, and the remaining E and P cores at full load with high QoS threads. That would require:
- For E cores at low QoS, 60 mJ overhead plus 300 mJ for two cores, plus
- 1800 mJ for four E cores run at high QoS, plus
- for P cores, 450 mJ overhead plus 5520 mJ for six cores,
- for a total energy use of 8130 mJ.
A similar load on an M3 Max might come to
- Two E cores at low QoS, the same 360 mJ, plus
- for P cores, 900 mJ for two P cluster overheads, and 9200 mJ for ten P cores,
- for a total energy use of 10,460 mJ.
Although that would complete more quickly than on the M3 Pro, it would cost about 2.3 J or over 25% more for that additional speed.
Special modes
Virtualisation of macOS on the M3 Pro delivers better CPU core performance than running native on an M1 Pro/Max. On an M3 Pro, it’s perfectly reasonable to allocate a total of 8 CPU cores to macOS VMs, which would not be feasible on an M1 Pro/Max if you wanted to be able to do anything useful on the host at the same time.
There’s no evidence that Game Mode gains exclusive use of any E cores on an M3 Pro. The 18 GPU cores in an M3 Pro match or exceed the performance of the 24 in a basic M1 Max. When processing Compute tasks, the GPU in an M3 Pro can use a sustained 23-24 W, exceeding that of the M1 Max, and that needs to be considered in the power budget when running on battery. Intensive graphics tasks are more likely to use 4-10 W, though.
Vector processing in NEON
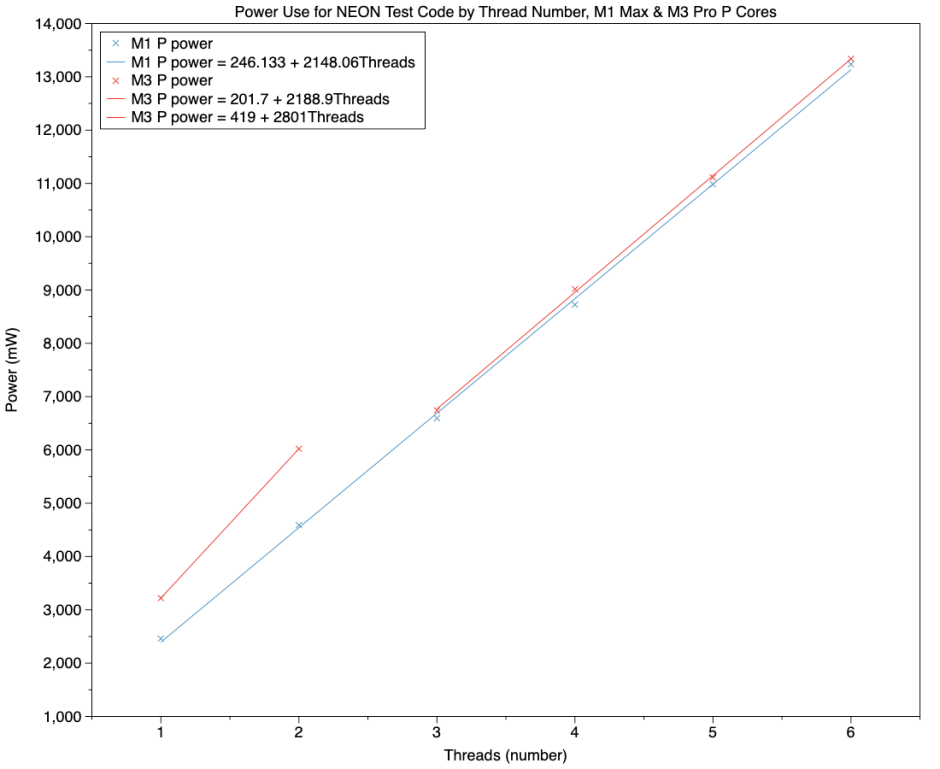
When running threads containing code for the NEON vector processor, frequency control is complex, and depends on the number of active cores in a cluster. This is most complex in the M1 Max.
Overall NEON performance of the P cores in the M3 Pro is about 140% of that in the M1 Max, more than can be accounted for by frequency differences. This improved performance is delivered without any increase in power use, on three and more active cores. With smaller numbers of cores, though, the M3 Pro does use significantly more power when running NEON code. Those are shown in the chart above, in blue for the M1 Max and in red for the M3 Pro. Although the M1 Pro/Max use an ingenious solution to get better NEON performance from their two E cores, those in the M3 Pro are more consistent, capacious and flexible.
Matrix co-processor
Finally I tried less successfully to discover differences in more complex computation believed to be run on Apple’s undocumented AMX co-processor. Throughput of vDSP FFT and Sparse Solver tasks shows complex relationships with the number of test threads. Relative to the M1 Max, the M3 Pro generally attained substantially higher throughput, ranging from 135% to over 170%.
Rule of thumb for upgrading
If you already have an Apple silicon Mac and are wondering whether to upgrade to an M3 model, you can use this rule of thumb as a way of working out which chip you’ll need.
Load your current Mac up with the apps you normally use together when working, and watch their use in Activity Monitor’s CPU History window. If most or all of its P cores are fully occupied much of the time, and that workload often spills over to the E cores, then you should aim for an M3 with more P cores (Max); if there’s always adequate spare capacity on the Mac’s P cores, then you probably wouldn’t get much added value from an M3 with more P cores.
Links to full articles
- 1 General performance
- 2 Power and energy
- 3 Special CPU modes
- 4 Vector processing in NEON
- 5 Quest for the AMX
I will continue to look in more detail at the matrix co-processor (AMX) in both M1 Pro/Max and M3 Pro, so there will be further articles coming in the future.
