
Evaluating the performance of CPUs with identical cores is relatively straightforward, and they’re easy to compare using single- and multi-core benchmarks. When there are two different types of core, one designed primarily for energy efficiency (E), the other for maximum performance (P), traditional benchmarks can readily mislead. Multi-core results are dominated by the ratio of P to E cores, and variable frequency confounds further. In this series of articles, I set out to disentangle these when comparing core performance between Apple’s original M1 Pro and its third-generation M3 Pro chips.
This first article explains why and how I am investigating this, and shows overall results for performance and power use under a range of loads.
Why?
Many different factors determine CPU performance, and traditional benchmarks normally try to look at them all simultaneously across a range of computing tasks, drawn from those that might be encountered in ‘normal’ use. Those factors range from the number of core cycles to execute instructions, through core frequency, to cache and main memory access. The tests I use here focus on the core itself, and how rapidly it can execute a tight loop of code that requires no cache or other memory access. Execution rate should therefore be determined by core design, which type of core that thread is run on, and control over the core’s frequency.
Methods
I use a GUI app wrapped around a series of loading tests designed to enable the CPU core to execute that code as fast as possible, and with as few extraneous influences as possible. Of the four tests reported here, three are written in assembly code, and the fourth calls a highly optimised function in Apple’s Accelerate library from a minimal Swift wrapper. These tests aren’t intended to be purposeful in any way, nor to represent anything that real-world code might run, but simply provide the core with the opportunity to demonstrate how fast it can be run at a given frequency, and how macOS manages core types and determines those core frequencies. Without understanding at this level, interpreting other benchmarks becomes impossible.
The four tests used here are:
- 64-bit integer arithmetic, including a MADD instruction to multiply and add, a SUBS to subtract, an SDIV to divide, and an ADD;
- 64-bit floating point arithmetic, including an FMADD instruction to multiply and add, and FSUB, FDIV and FADD for subtraction, division and addition;
- 32-bit 4-lane dot-product vector arithmetic, including FMUL, two FADDP and a FADD instruction;
simd_float4calculation of the dot-product usingsimd_dotin the Accelerate library.
Source code of the loops is given in the Appendix.
The GUI app sets the number of loops to be performed, and the number of threads to be run. Each set of loops is then put into the same Grand Central Dispatch queue for execution, at a set Quality of Service (QoS). Timing of thread execution is performed using Mach Absolute Time, and the time for each thread to be executed is displayed at the end of the tests.
I normally run tests at either the minimum QoS of 9, or the maximum of 33. The former are constrained by macOS to be run only on E cores, while the latter are run preferentially on P cores, but may be run on E cores when no P core is available. All tests are run with a minimum of other activities on that Mac, although it’s not unusual to see small amounts of background activity on the E cores during test runs.
In addition to the times required to complete execution of each thread, most tests are also run during a period in which powermetrics is collecting measurements from the CPU cores. Those are collected over sampling periods of 0.1 second, typically for 5 seconds in total.
powermetrics returns three measurements used throughout these articles:
- Core frequency is given as an average over the collection period. As this is set by macOS for each cluster, frequencies of all cores within any given cluster are the same, even though some may not be actively processing instructions.
- Active residency is given for individual cores, and may vary widely between cores in any cluster. This is the percentage of time that core isn’t idle, but is actively processing instructions. In places, I total those individual core values to give a cluster total active residency; for a cluster of six cores, its maximum will thus be 600%. This is the basis for CPU measurements shown in Activity Monitor, which don’t take core frequency into account.
- CPU power is an estimate of the average total power used by all the CPU cores together, over the sampling period.
Example results
Because each test thread is a single series of tight loops, each is normally executed on a single CPU core, although some are relocated from one core to another during execution. The following presents the detailed powermetrics results for a single test run, here of four floating point test threads, each consisting of 200 million loops, run at high QoS (33) on a MacBook Pro 16-inch M3 Pro.
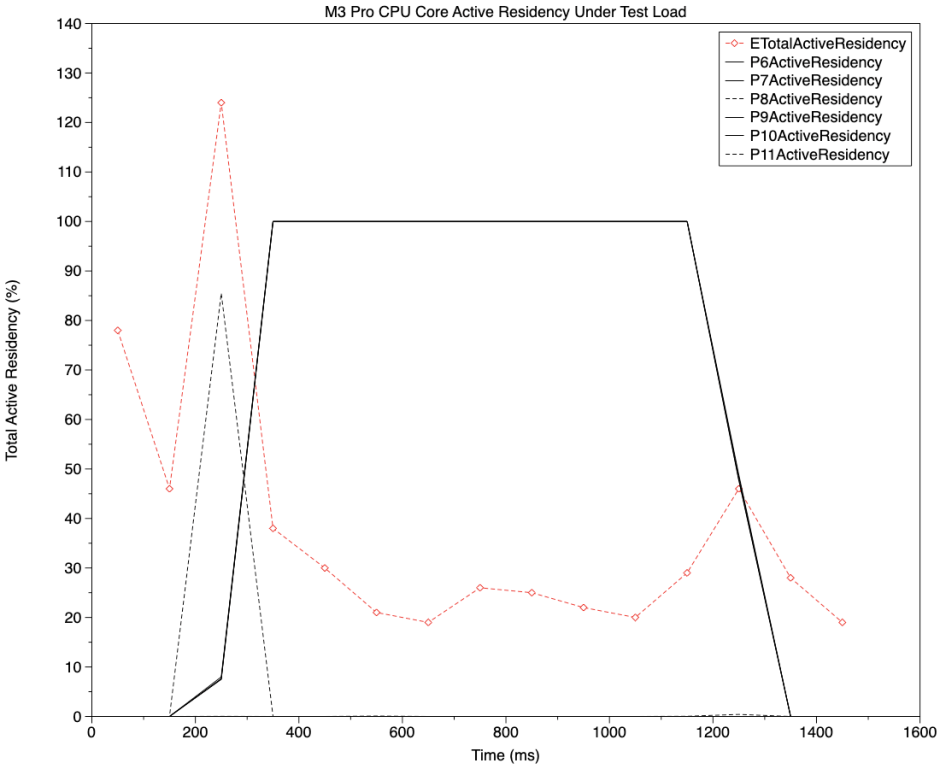
This chart shows active residency of cores during the four-thread test, with individual P cores shown in black, and the total for the whole E cluster shown in red. The cores were loaded with four threads shortly after 200 ms, and the test was completed before 1400 ms. Test threads were only run on cores numbered 6, 7, 9 and 10, whose active residencies followed the almost identical solid black lines, on the P cores. P8 showed a brief period of high active residency as the threads loaded, as did cores in the E cluster. During the test, the four P cores remained at 100% active residency, so that each thread accounted for all activity on a single P core.
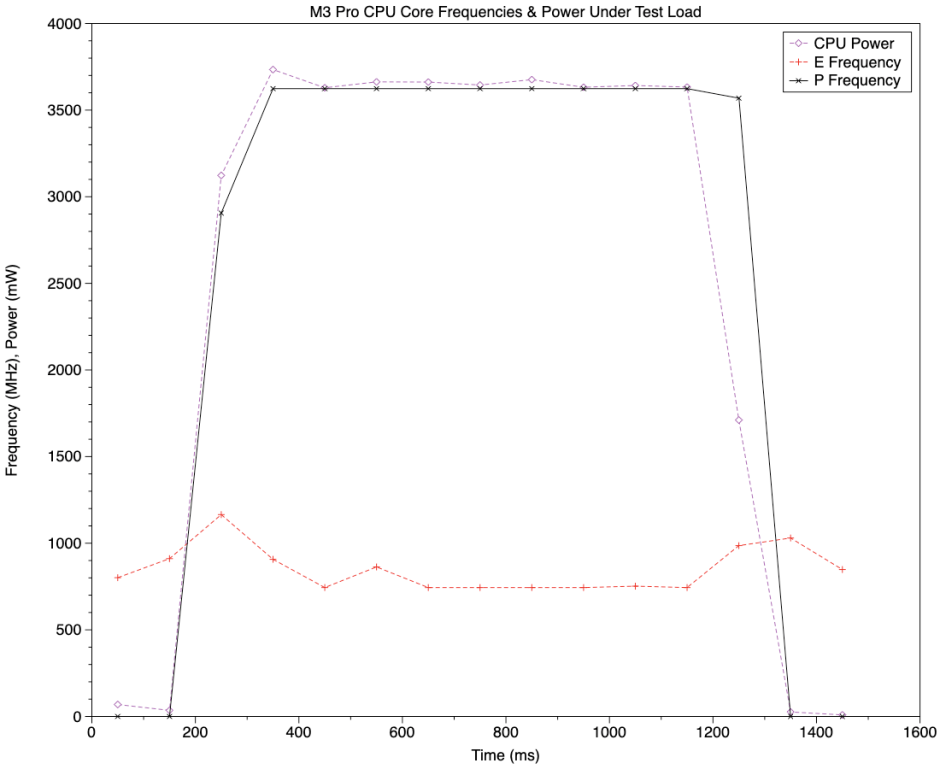
This chart shows core frequencies and total CPU power used during the same test, with four threads, each running on a single P core throughout. Frequency of the six P cores rose similarly rapidly as the threads were loaded, and fell when they were complete. The steady maximum P core frequency here was 3624 MHz. E core frequency (red) changed little during this test, with small peaks during thread loading and unloading. Total CPU power use is shown in purple (with open diamond points), and follows P core frequency and active residency, with a plateau of around 3660 mW.
Measured times to run each loading thread were 1.05 seconds, which matches the interval seen between loading and completion here, with all four threads being run concurrently.
Single core performance
The simplest comparison that can be made between M1 Pro and M3 Pro CPU cores is that between single-thread (hence, single-core) loop throughput for each of the four tests. These are shown first for P cores, then for E.
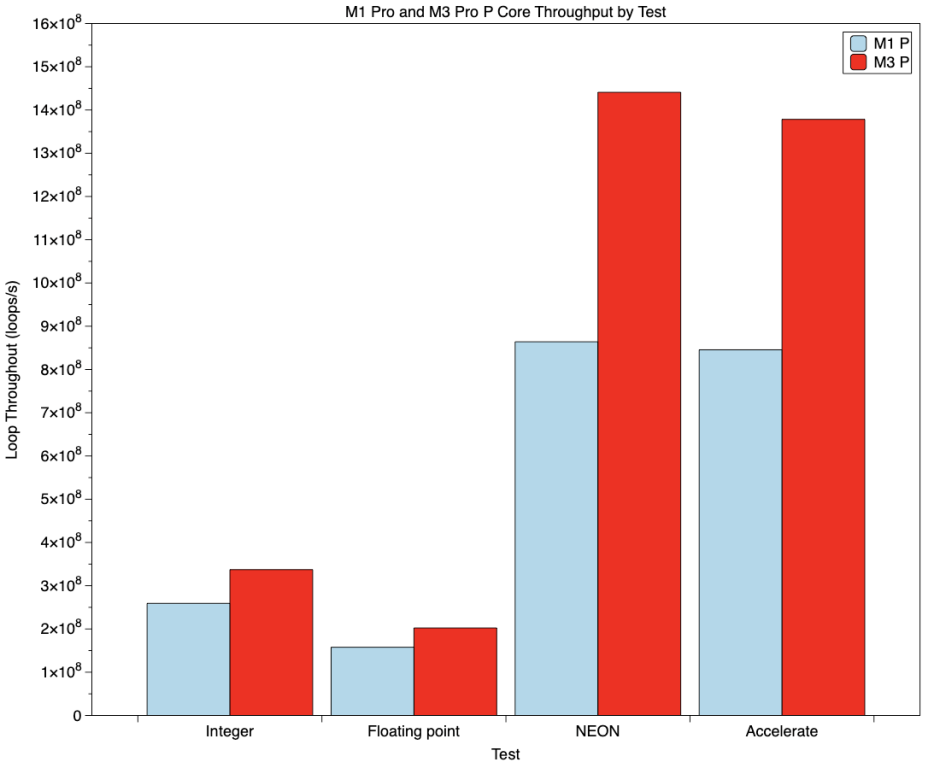
Relative to the throughput measured on a P core in the M1 Pro, P cores in the M3 Pro ran at 130% (integer), 128% (floating point), 167% (NEON) and 163% (Accelerate) throughput. The first two represent a modest improvement that could be attributed to the difference in core frequency. M3 Pro P cores have a maximum frequency of 4056 MHz, 126% of the maximum of 3228 MHz in the M1 Pro. However, while the M1 P core was running at its maximum frequency, that in the M3 was running at 3624 MHz, only 112% that of the M1. In practice, this suggests that the integer and floating point loads did run faster than would be expected on the basis of core frequency alone.
That difference between M1 and M3 is even greater for the NEON and Accelerate tests, where the M3 Pro performs substantially better than the M1 Pro even when allowing for the greatest possible difference in their frequency.
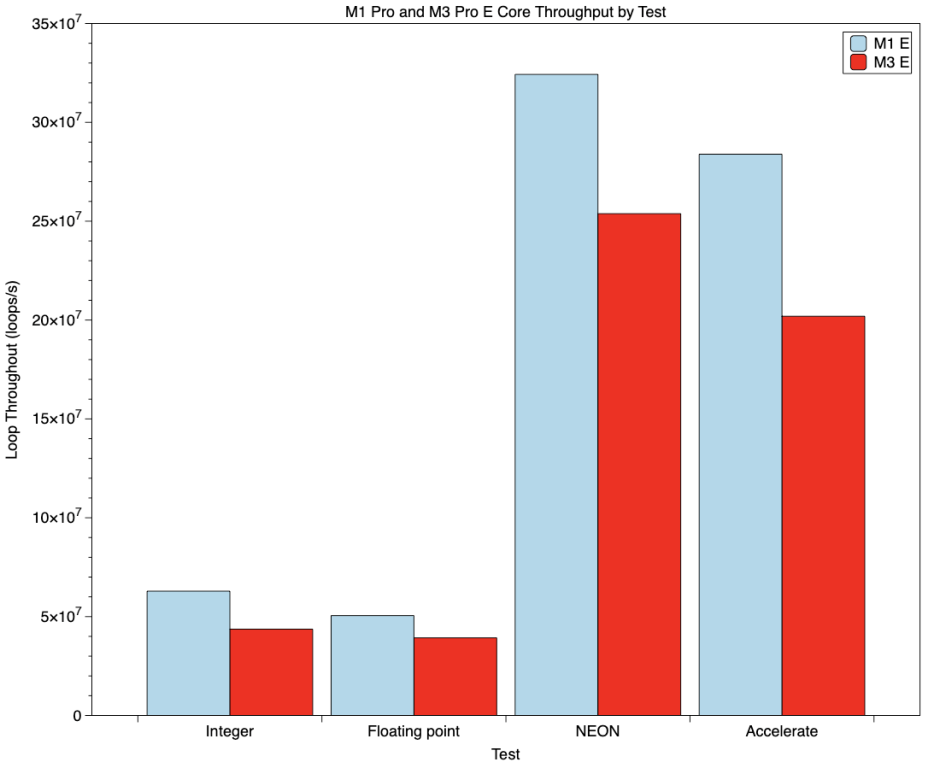
E cores in the M3 Pro also have a higher maximum frequency (2748 MHz) than those in the M1 Pro (2064 MHz), but in practice low QoS threads run significantly slower on the M3, because the M3 runs low QoS threads at only 744 MHz, whereas the M1 Pro runs them at 972 MHz. On the basis of frequency alone, M3 E core throughput would be expected to be 77% that of M1 E cores, which it is for floating point and NEON (both 78%), but the M3’s E cores are slightly worse in Accelerate (71%) and integer (69%) tests.
Thus, on single core performance, the M3’s P core delivers more than you’d expect on frequency alone, particularly for vector computation, but its E cores run more slowly for low QoS threads.
Multi-core performance
It’s time to look at how the M3 runs on more cores, and how P and E cores work together. For this, I collate the results from running just one type of test thread, floating point arithmetic, in different numbers and at high and low QoS.
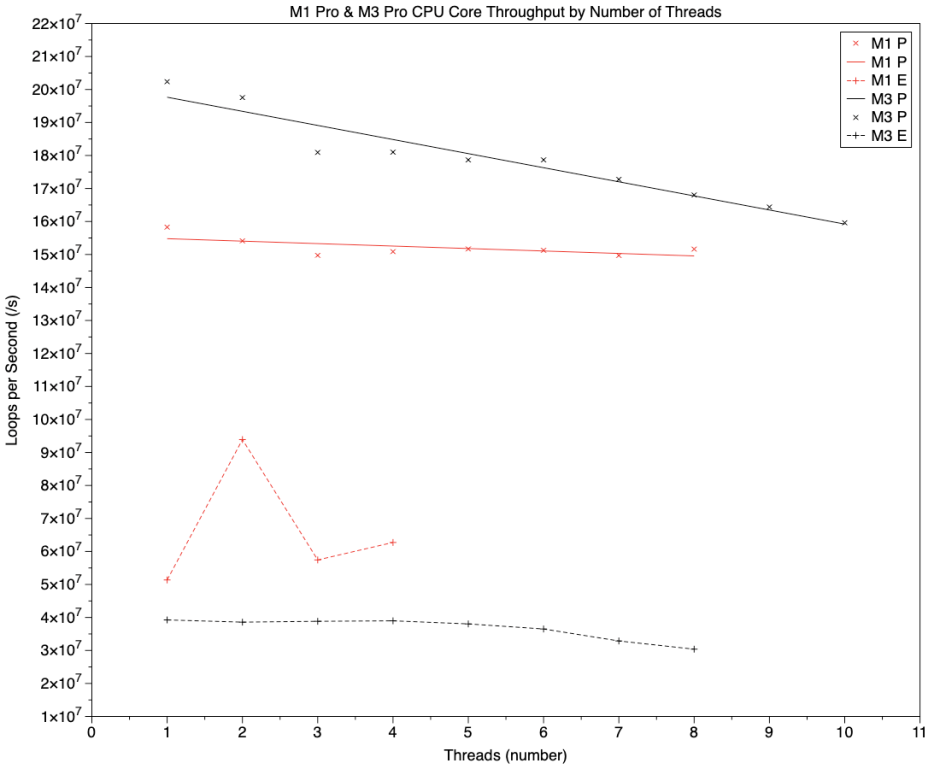
This chart shows loop throughput per thread (core) attained by one and more cores on the two chips.
Starting with the E cores alone, and low QoS, shown in the lower pair of lines, the M1 Pro (red) and M3 Pro (black) are completely different. The M1 Pro pulls a trick here: although a single thread running on one E core delivers a throughput slightly greater than that of one thread on one E core on an M3 Pro, there’s a much larger difference when running two threads. That’s because macOS increases the frequency of the two-core E cluster in the M1 Pro from 972 MHz to close to its maximum of 2064 MHz. This appears intended to compensate for the small size of the cluster.
When running three or more threads, the M1 Pro runs out of E cores, and the additional threads have to be queued to be run when one of those E cores is available again. With its six E cores, the M3 Pro plods on more slowly, but doesn’t have to start queueing threads until the seventh, resulting in a fall in throughput.
The P cores, in the upper pair of lines, are more similar. Throughput remains linear in the eight P cores of the M1 Pro (red), up to its total of eight threads. Although the M3 Pro (black) has only six P cores, as these are run at high QoS they can readily be accommodated on free E cores, resulting in the E core frequency being increased to around 2748 MHz. This does lead to a slow decline in throughput with 7-10 threads, but even when running threads on all its six P cores and four of its E cores, the M3 Pro achieves a throughput slightly higher than that of a single thread on an M1 Pro P core.
Power
Because power use is so different between E and P cores, I’ll consider E cores alone to start with.
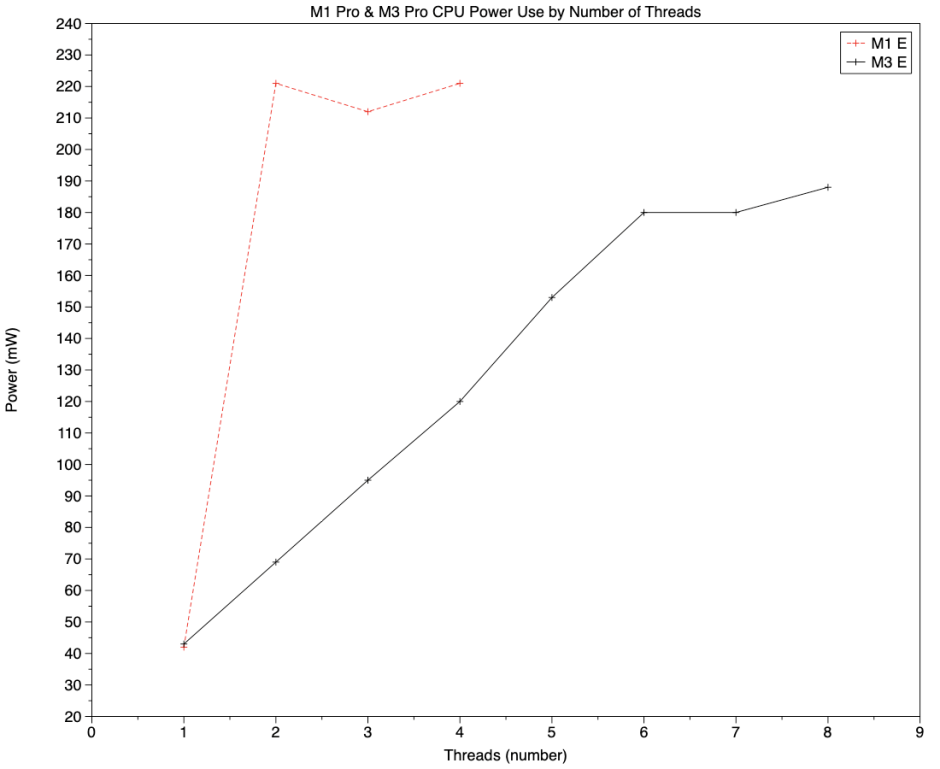
This chart shows total CPU power used by different numbers of threads running on the E cores of the M1 Pro (red) and M3 Pro (black). Although they start at an almost identical value for one thread (one core), they rapidly diverge, with the M3 remaining below the power used by two or more threads on an M1 Pro, even when it’s running 6-8 threads. This difference is substantial: at two threads, it amounts to about 150 mW, and at four it’s still over 100 mW.
In comparison, the P cores use 20-25 times as much power as the E cores.
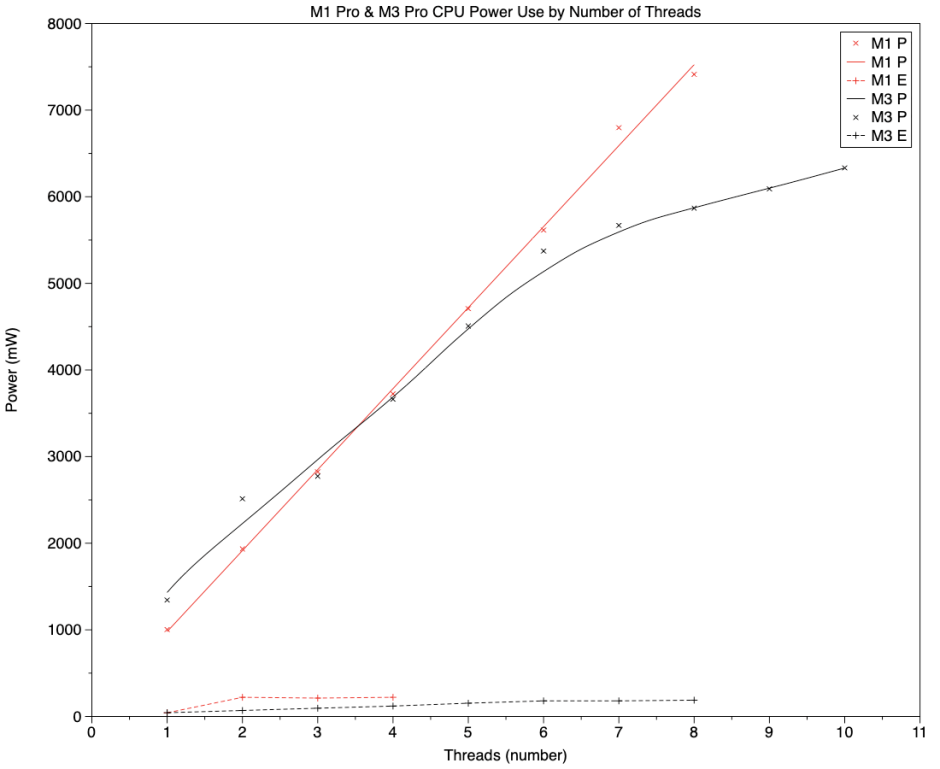
Total CPU power use is shown here for both P and E core loads on the M1 Pro and M3 Pro. The lower pair of lines shows those for E cores alone, from the previous chart, and the upper pair show those for high QoS loads running on P and, when needed, E cores, for the M1 Pro (red) and M3 Pro (black). That for the eight P cores in the M1 Pro is linear up to its total of 8 cores, and points for the M3 Pro are close up to its cluster size of six P cores. These give the power cost of each additional P core at about 935 mW, for either chip. Above six threads, recruitment of E cores in the M3 Pro results in improving power efficiency, though. As the M1 Pro only has two E cores, overflowing threads from P to E cores isn’t such a good idea, because of its potential impact on low QoS threads that are confined to running on those E cores.
Conclusions
- There are substantial differences in performance and efficiency between the CPU cores of M1 Pro and M3 Pro chips.
- P cores in the M3 Pro consistently deliver better performance than those in the M1 Pro. Gains are greater than would be expected from differences in frequency alone, and are greatest in vector processing, where throughout in the M3 Pro can exceed 160% of that in the M1 Pro. These gains are achieved with little difference in power use.
- E cores in the M3 Pro run significantly slower with background, low QoS threads, but use far less power as a result. When running high QoS threads that have overflowed from P cores, they deliver reasonably good performance relative to P cores, but remain efficient in their power use.
- M3 Pro CPU cores are both more performant and more efficient than those in the M1 Pro.
Appendix: Source code
_intmadd:

STR     LR, [SP, #-16]!

MOV     X4, X0

ADD     X4, X4, #1

int_while_loop:

SUBS    X4, X4, #1

B.EQ    int_while_done

MADD    X0, X1, X2, X3

SUBS    X0, X0, X3

SDIV    X1, X0, X2

ADD     X1, X1, #1

B       int_while_loop

int_while_done:

MOV     X0, X1

LDR     LR, [SP], #16

RET
_fpfmadd:

STR     LR, [SP, #-16]!

MOV     X4, X0

ADD     X4, X4, #1

FMOV    D4, D0

FMOV    D5, D1

FMOV    D6, D2

LDR     D7, INC_DOUBLE

fp_while_loop:

SUBS    X4, X4, #1

B.EQ    fp_while_done

FMADD   D0, D4, D5, D6

FSUB    D0, D0, D6

FDIV    D4, D0, D5

FADD    D4, D4, D7

B       fp_while_loop

fp_while_done:

FMOV    D0, D4

LDR     LR, [SP], #16

RET
_neondotprod:

STR     LR, [SP, #-16]!

LDP     Q2, Q3, [X0]

FADD    V4.4S, V2.4S, V2.4S

MOV     X4, X1

ADD     X4, X4, #1

dp_while_loop:

SUBS    X4, X4, #1

B.EQ    dp_while_done

FMUL    V1.4S, V2.4S, V3.4S

FADDP   V0.4S, V1.4S, V1.4S

FADDP   V0.4S, V0.4S, V0.4S

FADD    V2.4S, V2.4S, V4.4S

B       dp_while_loop

dp_while_done:

FMOV    S0, S2

LDR     LR, [SP], #16

RET
func runAccTest(theA: Float, theB: Float, theReps: Int) -> Float {

var tempA: Float = theA

var vA = simd_float4(theA, theA, theA, theA)

let vB = simd_float4(theB, theB, theB, theB)

let vC = vA + vA

for _ in 1...theReps {

tempA += simd_dot(vA, vB)

vA = vA + vC

}

return tempA

}
