
I was yet again spectacularly wrong in speculating that we had another eight months to wait before Apple would release the first Macs with M3 chips. Another few days and the first will be upon us, and the fortunate few will start bragging or moaning about their performance. That has suddenly grown more complex: the number of each CPU core type has diversified with the M3 Pro in particular. This article looks at some of the factors involved in comparing CPU performance across Apple’s expanded range of M-series chips.
Core capability
The terms Performance and Efficiency are convenient labels, but there’s important detail in the architecture of core types. E cores achieve their enhanced energy efficiency by a combination of running at lower frequency and having fewer processing units. Each of the M1’s Icestorm E cores are roughly half a Firestorm P core, so all other factors being equal, an Icestorm E core would be expected to perform at about half the throughput of a Firestorm. Although I haven’t seen similar analysis for the M2’s Blizzard (E) and Avalanche (P) cores, I would expect a similar difference, and in the M3.
Frequency management
Not only do the core types differ in their maximum frequencies, typically over 3 GHz for P and 2 GHz for E cores, but their frequency management can be quite different depending on which chip they’re running in. Frequency control of both core types is highly dynamic, and they can go from idle to maximum remarkably quickly when required. This became apparent when I looked at P and E core frequency management in the basic M1 and M1 Pro/Max chips.
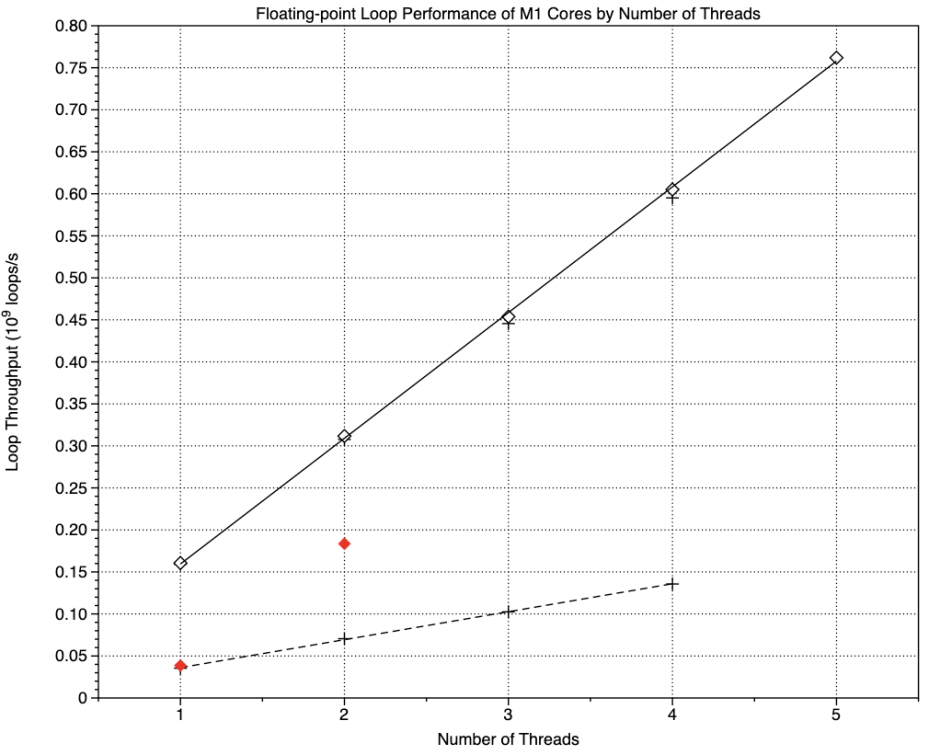
This graph shows the relationship between the rate of executing tight CPU code loops of basic floating point arithmetic with only register access, and the number of threads, equating to the number of cores being used.
The upper solid line shows this relationship for P cores being used at maximum Quality of Service (QoS). Each thread effectively adds 0.15 billion loops/second to total throughout, whether on an original M1 (+ points) or M1 Pro (♢ unfilled diamonds). Although not shown here, on an M1 Pro that line continues up to its total of eight P cores.
The broken line below shows the same relationship for E cores in an original M1, this time each thread adding 0.033 billion loops/second, 22% of the throughout of each P thread. Shown in red, though, are the equivalent points for the two E cores in an M1 Pro (or Max): with one thread, throughput is the same as an original M1, but with both cores active, throughput more than doubles that of two threads on the original chip. That’s macOS controlling the E core frequency to ensure that M1 Pro and Max chips don’t perform any slower than those in the original M1, and in fact are here slighter faster than all four E cores together, running at 1000 MHz.
Cluster architecture
In M-series chips CPU cores don’t operate independently, but are grouped together into clusters of up to four cores that share L2 cache and are run at the same frequency. In M1 and M2 chips, most P clusters have consisted of four cores, while E clusters have been either two or four in size. M3 Pro chips are the first for Apple silicon Macs in which there are two clusters of 4 and 2 cores, for each of the core types. That begs the question as to whether macOS will manage those with 4-core clusters activated first, leaving the 2-core clusters idling until they’re needed, or it will activate the 2-core clusters first. Although this will have little effect on performance, it should be significant for energy use.
E cores aren’t just for background threads
While P cores do deliver high performance, never underestimate the work that can be done by E cores. Sonoma’s new Game Mode dedicates the two E cores in M1 Pro and Max chips to the game, and in practice that works very well. M3 Pro chips with their six E cores may well not hand over all of those in Game Mode, but even four dedicated E cores should deliver ample for a wide range of apps, particularly those in which GPU performance is more critical.
In contrast, lightweight virtualisation of macOS loads P cores first, and the impact of running host apps alongside a macOS VM could limit performance more on an M3 Pro (6P + 6E) compared to an M1 Pro/Max (8P + 2E).
Beware of benchmarks
Although we’re going to hear a lot of results from benchmarking apps like Geekbench, remember that the tests they run don’t simulate real-world CPU usage. For instance, they’re designed to run the same processes on each core when being used to measure multicore performance. In reality, macOS should manage distribution of the very different threads running in real-world use, to make best use of the cores available. Benchmark results are but part of the evaluation of performance.
When you hear anyone making claims that the 6P + 6E design of the M3 Pro is merely 50% more than a regular M3 chip with its 4P + 4E, or slightly over half an M3 Max at 12P + 4E, get them to show you their evidence. Measuring and comparing the performance of Apple’s new M3 chips has become much more complicated, and that’s before we’ve even considered the GPU.
Finally, be very wary of what you see in Activity Monitor’s CPU History window. While it does show broad trends in the distribution of workload across different cores, it doesn’t take account of frequency. There’s a world of difference between an E core running at 100% and a frequency of 1 GHz and a P core running at 100% and well over 3 GHz. If you want the full picture, then you have to resort to tools like powermetrics.
