

One of the most distinctive features of Apple silicon chips is that they have two types of CPU core, E (Efficiency) cores that are energy efficient but slower than the P (Performance) cores, which normally run much of the code in the apps we use. Apps don’t decide directly which cores they will be run on, that’s a privilege of macOS, but they register their interest by setting a Quality of Service, or QoS, which is then taken into account when they’re scheduled to run. With the introduction of Game Mode in Sonoma, CPU scheduling can now work differently, with E cores being reserved for the use of games. This article looks at another atypical situation, when running a macOS virtual machine (VM) assigned a set number of virtual cores. How does macOS Sonoma handle that?
CPU cores
M-series chips contain different types and numbers of CPU cores, depending on the model:
- Base models contain 4 E and 4 P cores; for the M1, those are Icestorm and Firestorm respectively, while the M2 has Blizzard and Avalanche. These are configured in two clusters, one containing the E cores, the other the P cores. Within each cluster, all cores are run at the same frequency, and they share L2 cache.
- Pro and Max models contain 2-4 E and 6-8 P cores, in one E cluster and two P clusters, again running at a common frequency within the cluster, and sharing L2 cache.
- Ultra models contain 4 (M1) or 8 (M2) E and 16 P cores, their clusters having common frequencies and L2 caches.
In broad terms, allocation of executable threads to different cores depends on:
- The QoS assigned to each thread. Those given low values for background and maintenance tasks, including Time Machine backups and Spotlight indexing, are run on E cores, and have no external control to allow their rescheduling to P cores. Those with higher QoS can be run on either P or E cores, and external controls can restrict them to E cores alone, although they’ll normally be run on P cores when they’re available.
- Clustering. Because all cores in a cluster run at the same frequency, it’s more efficient to recruit additional cores in the same cluster, as they’ll already be running at a higher frequency, rather than a core in a different cluster, whose frequency may then need to be increased. Clusters are normally recruited in sequence too: in Macs with two P clusters, threads are normally run on the first of those (P0), and only when additional cores are required is the second (P1) recruited. Running with a light load, P0 is therefore likely to be more active than other P clusters, which may spend long periods idling.
- Order within a cluster. Although applied more loosely than other principles, there is an observed tendency to recruit cores in order within a cluster. Where the P0 cluster contains cores P2, P3, P4 and P5, threads tend to be loaded onto P2 first, and P5 last. However, running threads are often relocated within a cluster, following which P2 may be left idle, while P5 bears the brunt.
Thread scheduling and dispatch contains many more subtleties, but those influences normally dominate what you see in practice.
Virtual CPU cores
Under macOS lightweight virtualisation, virtual machines (VMs) are allocated a number of virtual CPU cores, all of which are the same type, equivalent to a P core. There is thus no option to allocate threads running in the VM to E cores on the host. This is illustrated in the following examples shown in Activity Monitor’s CPU History window.

Two different loads were applied to the M1 Max shown here: the two long peaks seen on the E cores were floating-point threads at a QoS of 9 for a background task, while the shorter peaks on four P cores were the same threads at a QoS of 33 for priority user tasks.
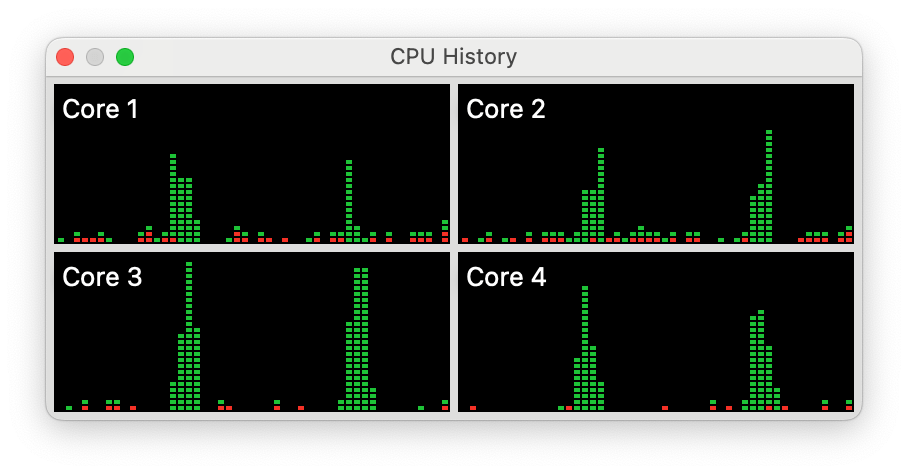
When the same sequence was run on a VM with 4 virtual CPU cores, the QoS made no difference to the performance or core allocation seen in the VM.

On the host, both thread loads were run similarly on the first cluster of P cores. This might suggest that the host simply hands over the cluster of P cores to be scheduled and dispatched by the VM. If you rely on what you’re shown in Activity Monitor, you could be tempted to reach that conclusion.
Methods
To assess core allocation for VMs, I used a Mac Studio M1 Max running Sonoma 14.0. A Sonoma 14.0 VM was built using Viable, and run during tests using that virtualisation app. Test loads were applied from the VM using my app AsmAttic, each thread running 5 x 10^8 tight loops of purposeless assembly code performing floating point arithmetic using registers alone. I detailed this here. Each thread typically takes about 3.2 seconds to complete, and serves here as an in-core load, not a benchmark. During each of those runs, powermetrics was run on the host to log cpu_power measurements over 0.1 second sampling periods. Frequency and active residency for all the cores was then extracted and analysed using DataGraph. Test runs included the same VM configured with 3 and 4 virtual cores, and with 1-6 threads, all at a QoS of 33.
Single threads
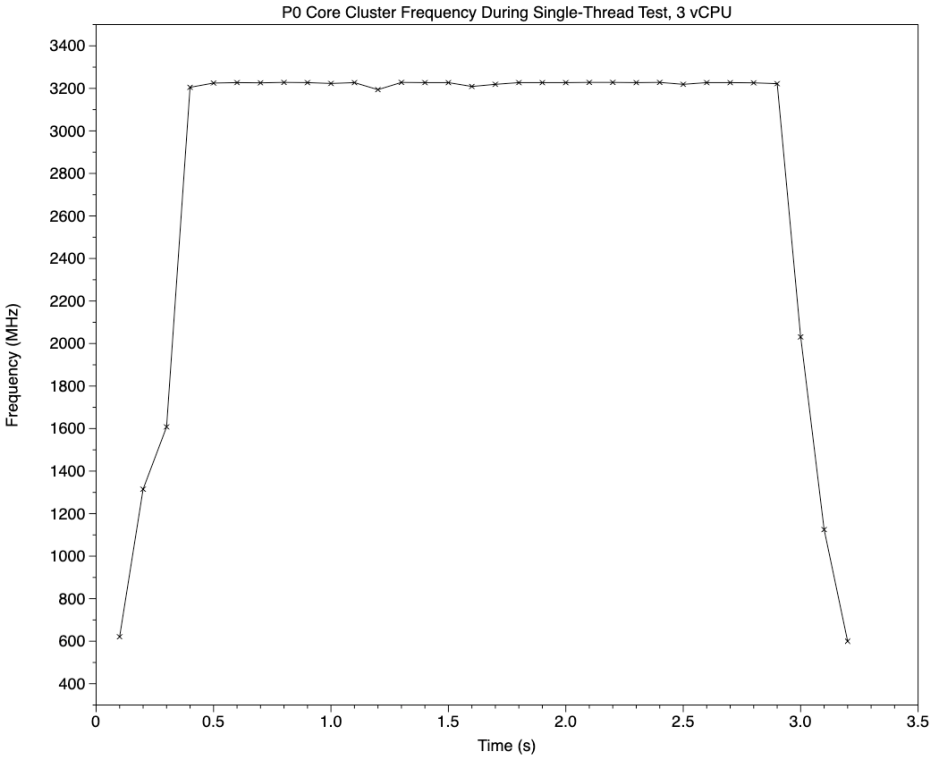
Running a single thread on three or four virtual cores resulted in the expected rapid change in P0 cluster frequency (above), and in active residency (percentage of available processor cycles that aren’t idle), shown below. As this gives total active residency for the whole cluster of four cores, its maximum is 400%. Although there are small peaks above the expected 100% for a single thread, those were probably threads from other processes.

Multiple threads
As the number of threads run on the VM increases, so the number of cores running them rises to the limit imposed by the number of virtual cores. Looking first at the effect on host clusters, these might imply that VM threads are confined to the single P cluster, P0.

This chart shows cluster frequencies for the three clusters in the M1 Max. The test load was applied just after 1 second, and was completed at about 4 seconds, matching the reported elapsed time of about 3.2 seconds. P0 frequency (solid line) rose rapidly to just over 3,000 MHz, and was sustained at that until completion. The other P cluster (P1) was run much of that time at its idle of 600 MHz, with short peaks up to 2,500 MHz. The E cluster was run throughout at about 1,000 MHz, with fewer and smaller peaks.

Here, to enable easier comparison, cluster active residency is shown with a scale maximum of 100% for each of the three clusters. The effect of the load on P0 active residency (solid line) dominates much as it did for frequency, but there are also many smaller and briefer peaks. To unravel what those represent, you need to analyse individual core responses.
Individual P cores
A simple starting point is analysing the active residency in P0 by individual core, for a single thread test.

This bar chart shows just the test period, here as sample number rather than time (each sample representing approximately 0.1 second). Active residency for the first core, P2, is shown in red, P3 in orange, P4 in blue, and P5 in purple. The bulk of the test thread was run on P2 to begin with, swapped over to P4, then brought back to P2 to complete. There are, though, significant contributions made by P3 as well.
Extending this analysis to other thread numbers, and 4 virtual cores, demonstrated that all cores in the P0 were used to run the test threads, which were moved around not infrequently during each test run.

It’s only when you look at active residency across all P cores that the picture becomes clear: when the second P cluster is active, it appears to be handling some of the test load. This shows active residency for all eight P cores, when running 4 threads on 4 virtual cores. To maintain the 400% required to complete the threads on time, there are several sample periods in which P6 and P7 take significant load, for example in samples 12 and 27, about 1 and 2.5 seconds into the test.
Core allocation of threads being run on virtual cores thus appears to follow the same general rules as host threads running at high QoS, and shows no particular affinity for clusters or cores. Thus virtualisation isn’t a different mode, as far as core allocation is concerned.
Conclusions
- Threads from VM virtual cores are invariably run at high QoS, and are scheduled and dispatched by the host macOS in accordance with its normal rules. Virtualisation doesn’t bring any special core allocation or CPU performance mode.
- Those threads are mobile across cores as with any other thread.
- There’s no evidence that macOS makes any attempt to allocate virtual cores to physical cores.
- Software in a VM has no means of designating that any of its threads should be run at lower QoS, or on host E cores. VMs thus lack energy efficiency and background performance advantages of macOS running on an Apple silicon host.
