
Yesterday, in my first look at what Game Mode does in Sonoma, I summarised its features as giving a game:
- highest priority access to the CPU,
- highest priority access to the GPU,
- reduced input and audio latency by doubling Bluetooth sampling rate,
- automatic access control by entering Full Screen mode.
Examining log records confirmed the third of those, with Bluetooth using its Low Latency Game Controller settings, and reducing audio latency. The first two are more difficult to assess without measuring CPU core and GPU performance with a tool like powermetrics, which I report here.
Methods
All tests reported here were run on a Mac Studio M1 Max, with its two Efficiency and eight Performance cores, and a GPU with 24 cores, running the full release version of macOS Sonoma 14.0. The game used was Gameloft’s Asphalt 9: Legends version 43008, purchased through the App Store.
Primary measurements used powermetrics sampling cpu_power and gpu_power over windows of 0.5 seconds. Additional support was provided by Activity Monitor, and my own Asmattic app running CPU benchmarks at set Quality of Service (QoS) values, as described below.
Power use
Perhaps the best overview of the effects of Game Mode on the CPU and GPU is this chart showing power consumption for the whole CPU and GPU during a run in Game Mode.
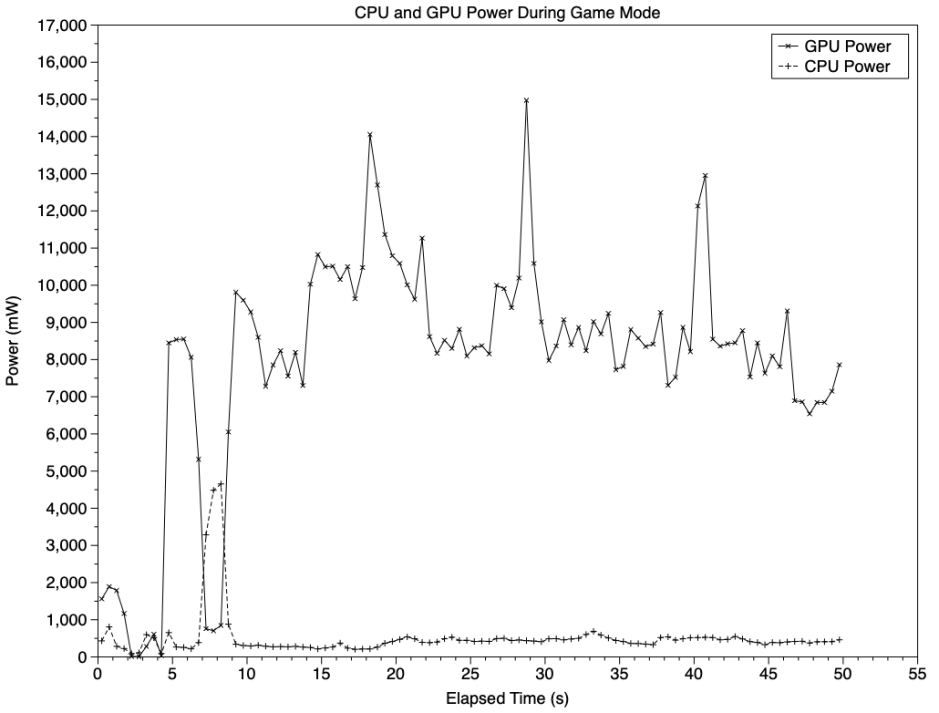
The game was put into Full Screen mode at 4-5 seconds elapsed time, and was running fully in Game Mode from about 10 seconds. Once established, total CPU power remained between 0.4-0.5 W, while the GPU used 8-15 W. This confirms the expectation that the brunt of the work was performed by the GPU.
CPU use
The next two charts provide details of the workload on the two different core types in the CPU. These ten cores are functionally divided into three clusters:
- 2 E cores in their own cluster,
- 4 P cores in the P0 cluster,
- 4 P cores in the P1 cluster.
Core frequency is controlled by macOS across each cluster, so at any moment, all the cores in any given cluster are running at the same frequency, which is determined according to the workload of that cluster. Active residency is the percentage of available processor cycles that aren’t idle, but total throughput is a combination of both active residency and frequency. A core running at half its maximum frequency and 100% active residency would be expected to process a similar number of instructions per millisecond as that of a core running at its maximum frequency with only 50% active residency. It’s a common error to use active residency as a direct indicator of core throughput, but without taking frequency into account, that’s misleading (and a known limitation of tools like Activity Monitor).
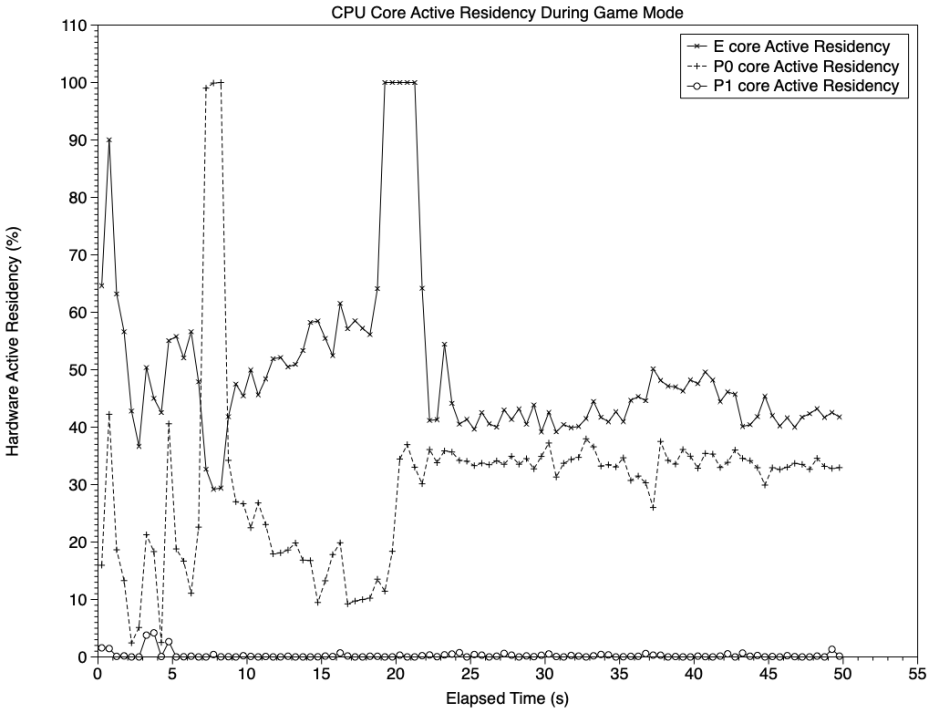
This chart, on the same timebase as the previous chart, shows average active residency for the three different clusters. After a brief spike during Game Mode setup prior to 10 seconds, active residency remains over 40% on the E cores (solid line), slightly lower on the first P cluster (broken line), and the second P cluster remains almost completely idle.
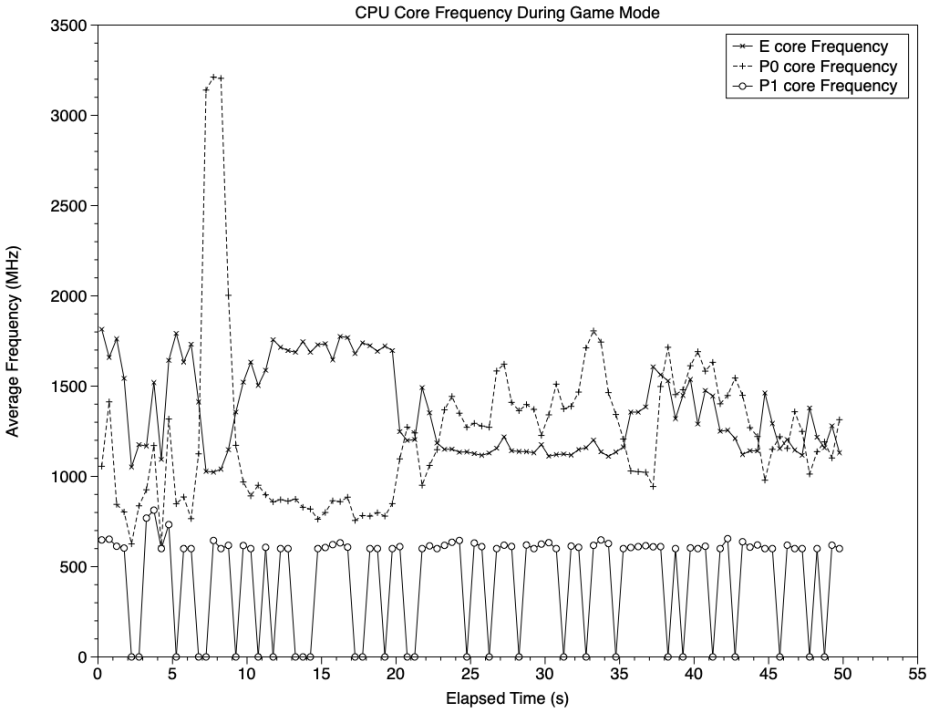
A similar pattern is seen for core frequencies. It’s important here to recall that these E cores have a maximum frequency of only 2064 MHz, while P cores have a maximum of 3228 MHz, reached briefly during their spike at about 8 seconds elapsed time. So for the whole of the time that Game Mode was active, the E cores were run at more than 50% of their maximum frequency, with an active residency of over 40%. The first cluster of P cores were run at less than 50% of their maximum frequency, with a lower active residency, and the second cluster of P cores was essentially idle throughout.
To provide a rough comparison between likely core throughput, two E cores at a frequency of 1200 MHz and 40% active residency is equivalent to a single E core at 960 MHz and 100% active. As E cores have roughly half the processing capacity of P cores, that equates to a single P core at 480 MHz and 100%. Four P cores at 1200 MHz and 35% is the equivalent of a single P core at 1680 MHz and 100%, 3.5 times the throughput of the E cores, but at greater energy cost.
During separate runs in Game Mode, attempts were made to run threads from other processes at low QoS (9), which normally constrains them to be scheduled for E cores alone, and at high QoS (33), which can be scheduled on any available cores. Those limited to E cores were completely blocked from being run until Game Mode was turned off, while those able to run on either core type ran at full speed while Game Mode remained active, on available P cores.
GPU use
Although information available from powermetrics on GPU performance is more limited than that for CPU cores, active residency and frequency give some insight into what happens in Game Mode.
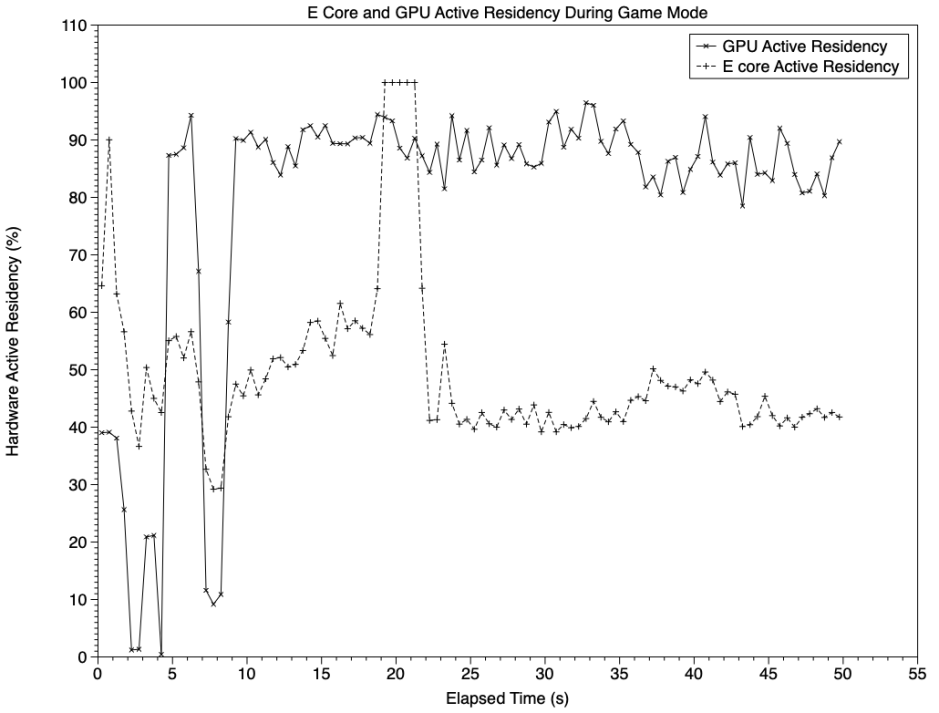
This chart shows active residency on the GPU (solid line) and E cores in the CPU. Switching to Full Screen mode with Game Mode on brought an immediate rise from about 40% on the GPU to around 85-95% for the rest of the period, when the E cores were at 40-60% much of the time, apart from a peak of 100% around 20 seconds.

powermetrics gives a range of GPU frequencies from 389-1296 MHz for the GPU. This chart, showing average frequencies for the GPU (solid line) and E cluster (broken line), demonstrates how variable their frequencies were. GPU frequency started a little under 650 MHz before entering Full Screen mode, then ranged from that up to over 950 MHz. The E cores remained above 1100 MHz throughout, peaking at over 1700, close to their maximum of 2064 MHz.
powermetrics also provides measures of ‘software state’ for the GPU, apparently in six P (priority?) levels, 1-6. For much of the time prior to entering Full Screen, requested state was P3. When in Game Mode, P4 and P5 were also frequent, with a small percentage of P6 too. At highest GPU power use, much of some sample periods were at P5 and P6.
Interpretation
Assembling these, it’s apparent that during Game Mode, the game was given exclusive use of the two E cores, and threads from other processes fixed at low QoS, which would require them to be run on the E cores, were kept waiting. The game’s threads were run on a combination of E and P cores, with much of their load being concentrated on the E cores. This appears to be energy-efficient, and ideal for use on notebooks running on battery power.
As promised by Apple, Game Mode also gives highest priority to access to the GPU. Although that offsets any energy savings from use of E cores, it ensures the user sees as good as their Mac’s hardware can deliver.
Previously, Apple’s approach to thread scheduling on the heterogeneous cores of its M-series chips was based on prioritisation using QoS, and managed in Grand Central Dispatch. This contrasts with Intel’s prescriptive Thread Director in giving apps the major say over which types of CPU cores threads can be run on, albeit indirectly. Game Mode is the first prioritisation mode that overrides other processes to dedicate CPU cores and GPU priorities to a single app. It will be interesting to see if it remains the only such mode for long.
Summary
Game Mode
- gives exclusive access to E cores,
- gives highest priority access to the GPU,
- uses low latency Bluetooth modes for input controllers, and audio output,
- is automatically engaged when a game is set to Full Screen mode,
- appears energy-efficient and effective.
