
For many, the log is like an insurance policy: you only use it when you need to, and that was normally rare until Apple introduced XProtect Remediator, XPR. Because that writes the results of its malware scans to the log, where they can be checked, you now want to have good logs with entries going back at least a day.
Traditional log systems retain old log records by the calendar, normally for around five days. During the early hours of the morning, daily housekeeping routines remove time-expired logs, leaving sufficient for you to look back those few days. But the macOS Unified log doesn’t work that way. Instead, its log maintainer logd sits in the background all the time and removes old log entries to keep the size of the log to just over 50 tracev3 files in the Persist folder, a total of a little more than 500 MB, regardless of how brief a period that might cover.
When you then go to check the last XPR scans, you’re told there aren’t any records of them in the log, because logd has removed all except those for the last few hours. How can you extend the period covered by your Mac’s log records?
Cheat
There are several good ways you can cheat those log records to ensure they catch XPR scans. The simplest is to shut your Mac down overnight, rather than leaving it running all the time. Letting it sleep instead can actually shorten the period covered by the log if your Mac keeps waking, as waking up can write even more log entries. But long periods of unbroken sleep can be a help when they occur.
You can also adjust the time you check XPR. To do that you first need to get a better idea of how long your Mac’s log entries last. This is available in XProCheck, Mints or LogUI. To use the last of those:
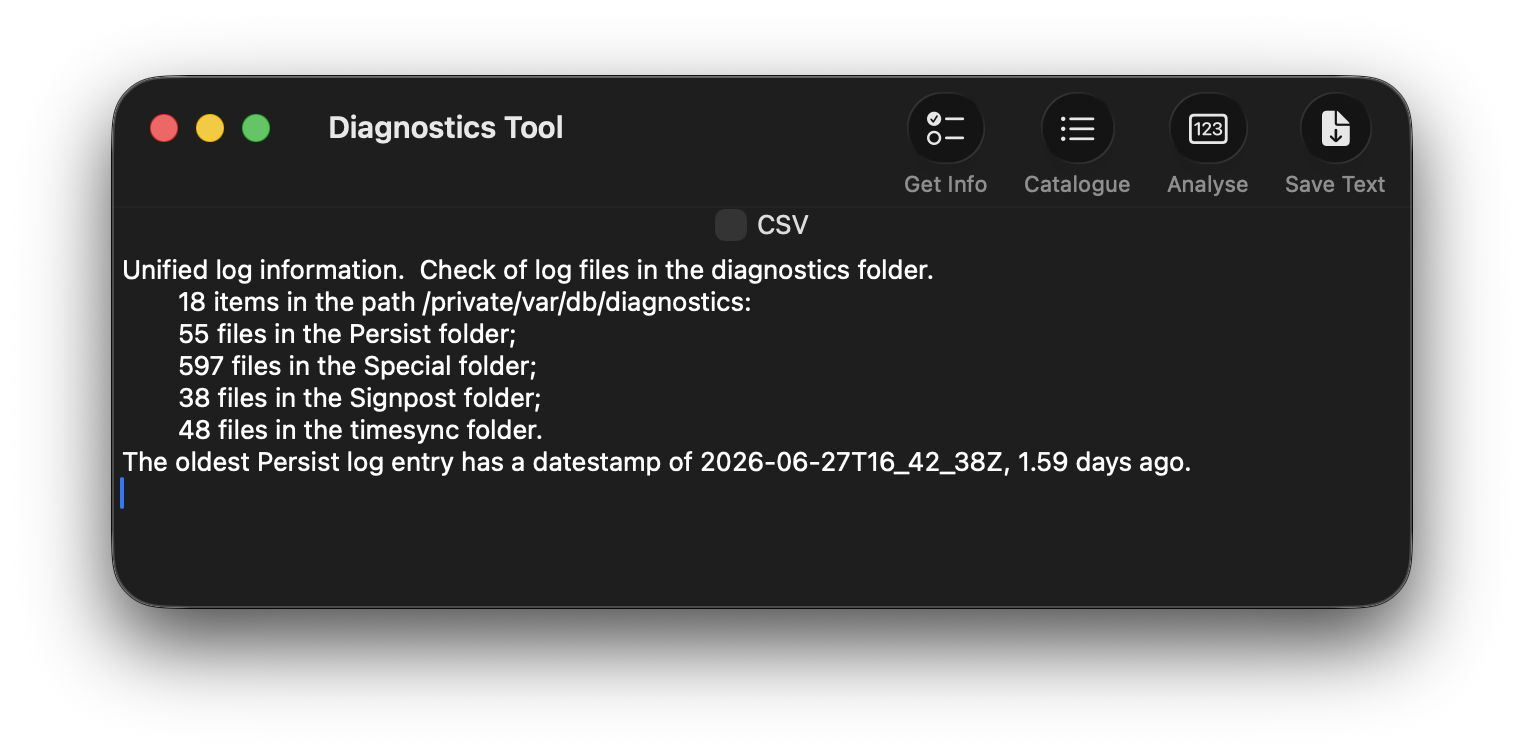
- Open the Diagnostics Tool using the command in the Window menu.
- Click on the Get Info tool at the left end of the window’s toolbar.
- In the Open dialog, select the /var/db/diagnostics folder for that Mac’s active log.
- Confirm there are at least 50 files in the Persist folder, forming the main log record.
- Make a note of the time period given in the last line, for the oldest Persist log entry.
Rarely, this highlights a different problem, in which log files don’t appear at all, or are drastically reduced in number. The most common cause of those is using a housekeeping utility that gleefully deletes your Mac’s log files. Please don’t do that, as those log files are indispensable.
XPR scans tend to be run at roughly the same time of day, provided the Mac is using mains power not battery, is awake and lightly loaded. If the time period given for log entries is 6 hours, check every 4-5 hours using XProCheck until you catch a set of scans. Then run your XPR checks so that time is covered by their log records. If your Mac is a laptop, XProtect Remediator scans will only be run it’s connected to its mains power adaptor, as they draw a lot of power while they’re running.
Discover log crises
Discovering why your logs are filling so quickly is more challenging, but the first thing to do is identify any periods when there are vast numbers of entries from some sort of crisis. If you can work out why those are happening, you may then be able to do something to stop further crises occurring. The best way to do that is to look at the log statistical summaries written by logd as part of its maintenance, using Logistician.
First create a new folder somewhere like ~/Documents, then show hidden files in the Finder with Command-Shift-. [period or stop] and navigate your way into log storage in /var/db/diagnostics. You’ll see typically four files containing log statistics, named logdata.statistics.0.jsonl and logdata.statistics.1.jsonl and a text twin of each. Copy all the jsonl files into the folder you just made in ~/Documents.
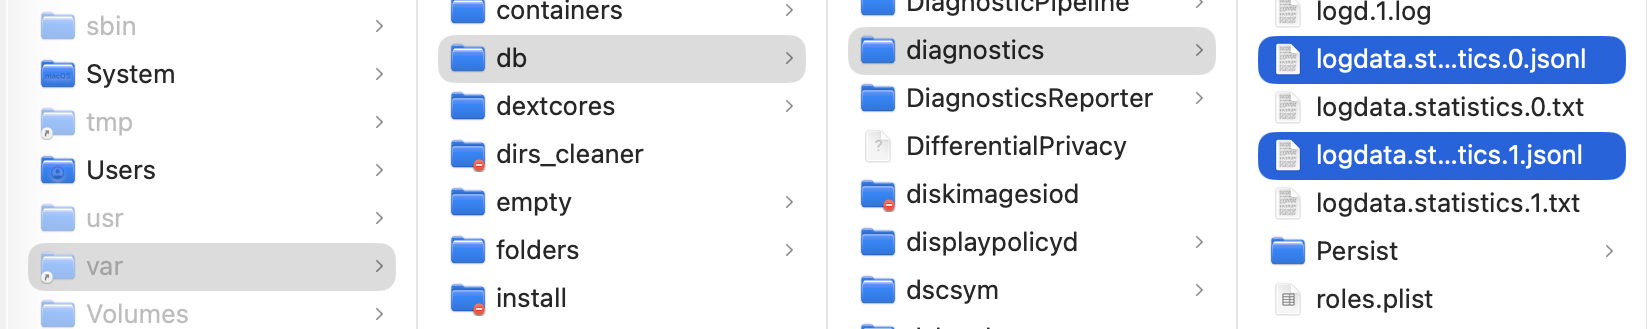
Open Logistician and click on its Read JSONL tool at the left end of its toolbar, then navigate to the folder in ~/Documents containing those jsonl statistics files. Of the two, logdata.statistics.0.jsonl is normally the smaller and more recently active, so select that to read into Logistician.
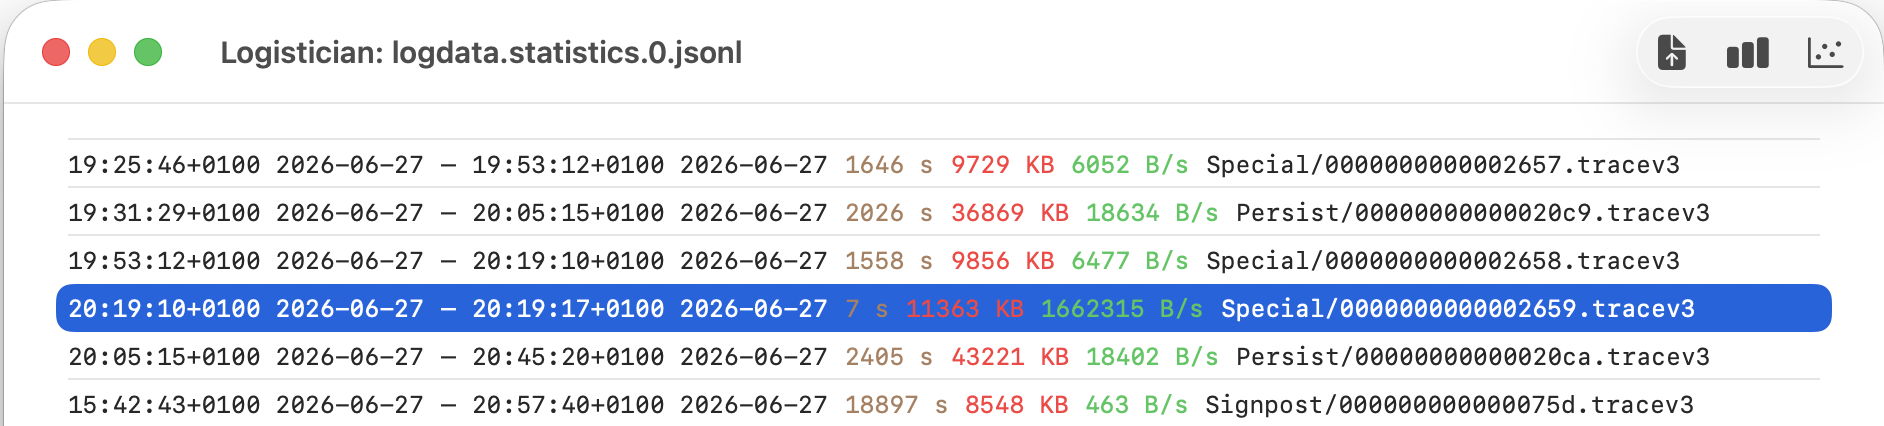
The app will then list all the log tracev3 files it has processed recently, normally over the last 36 hours or more. Ignore Signpost files listed there, and concentrate on Persist, containing the main body of log entries, and Special, usually longer additions. They’re listed in chronological order, with the oldest at the top, and the most recent at the bottom. Shown in brown are the time periods covered by each log file in seconds, and in green the number of bytes written per second to form that log file. So a log file with an entry like
20:19:10+0100 2026-06-27 20:19:17+0100 2026-06-27 7 s 11363 KB 1662315 B/s Special/00000000000002659.traccev3
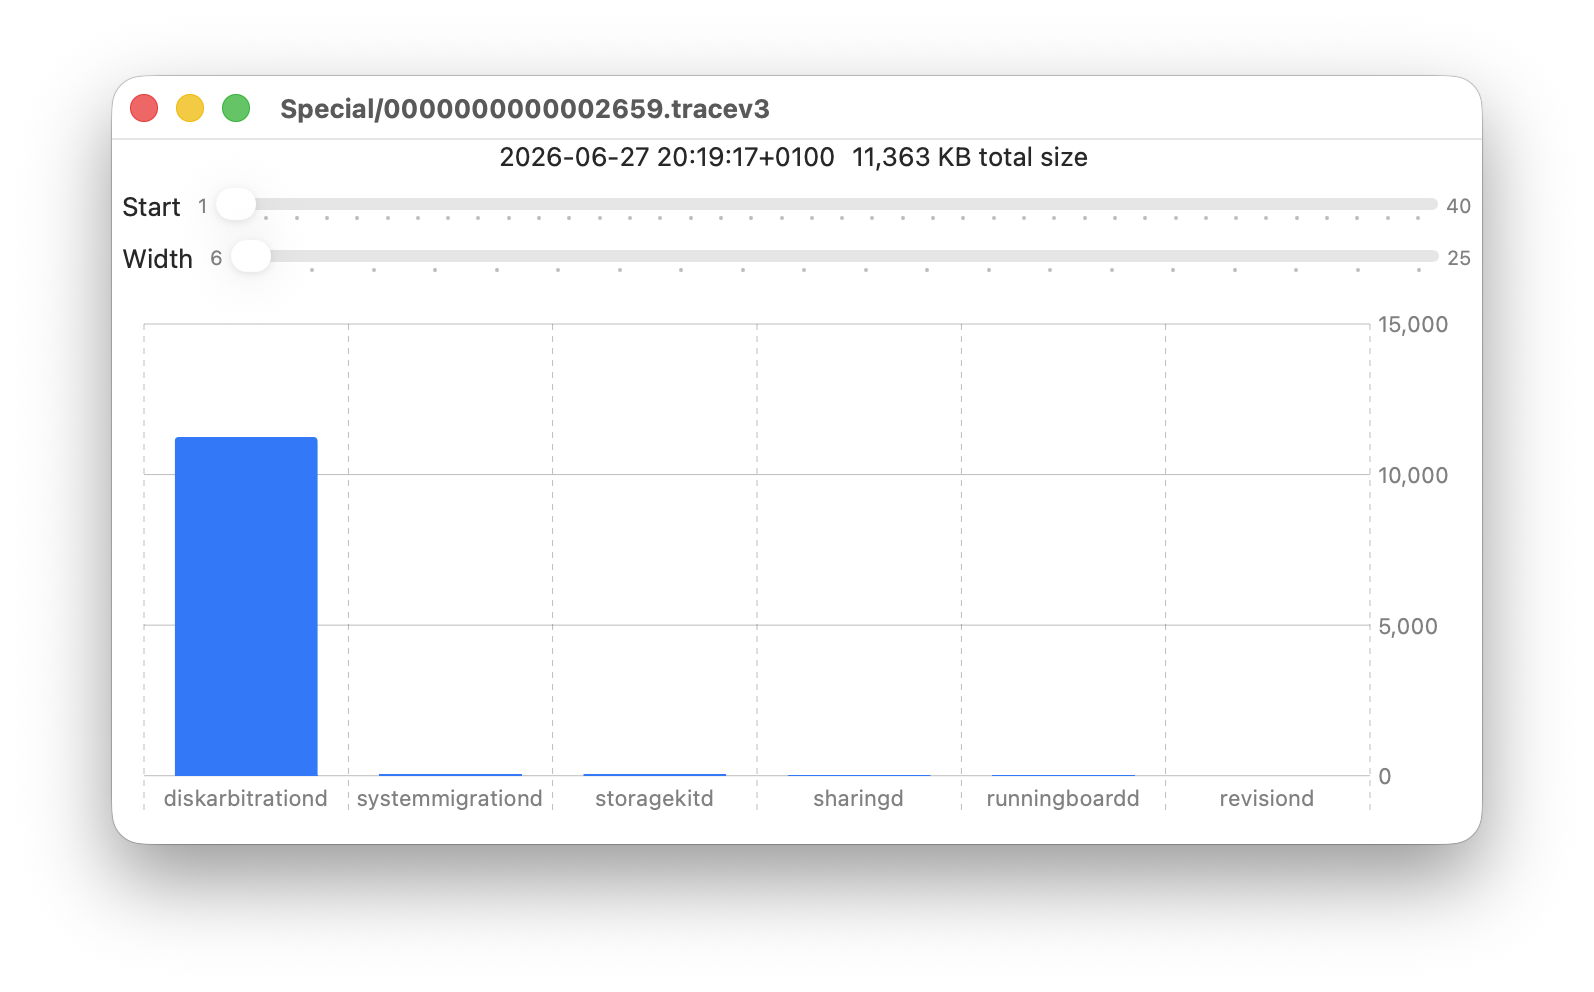
is a Special file that was written between those two times, containing 11 MB of log data written over a period of only 7 seconds, at a rate of 1.7 MB/s. That does appear to have been a crisis, so merits further investigation. To do that, select that entry in the list and click on the Chart selection tool.
This opens a bar chart showing the amount of log data written over that period, broken down by the process associated with each. In this case, the great majority came from diskarbitrationd, suggesting there might have been a problem with files at that time.
Because data in these statistics files can be retained for many weeks or months, this particular log file may have been removed already. If it has been retained you can point LogUI at that 7 second interval and browse the entries for clues as to why this might have occurred.
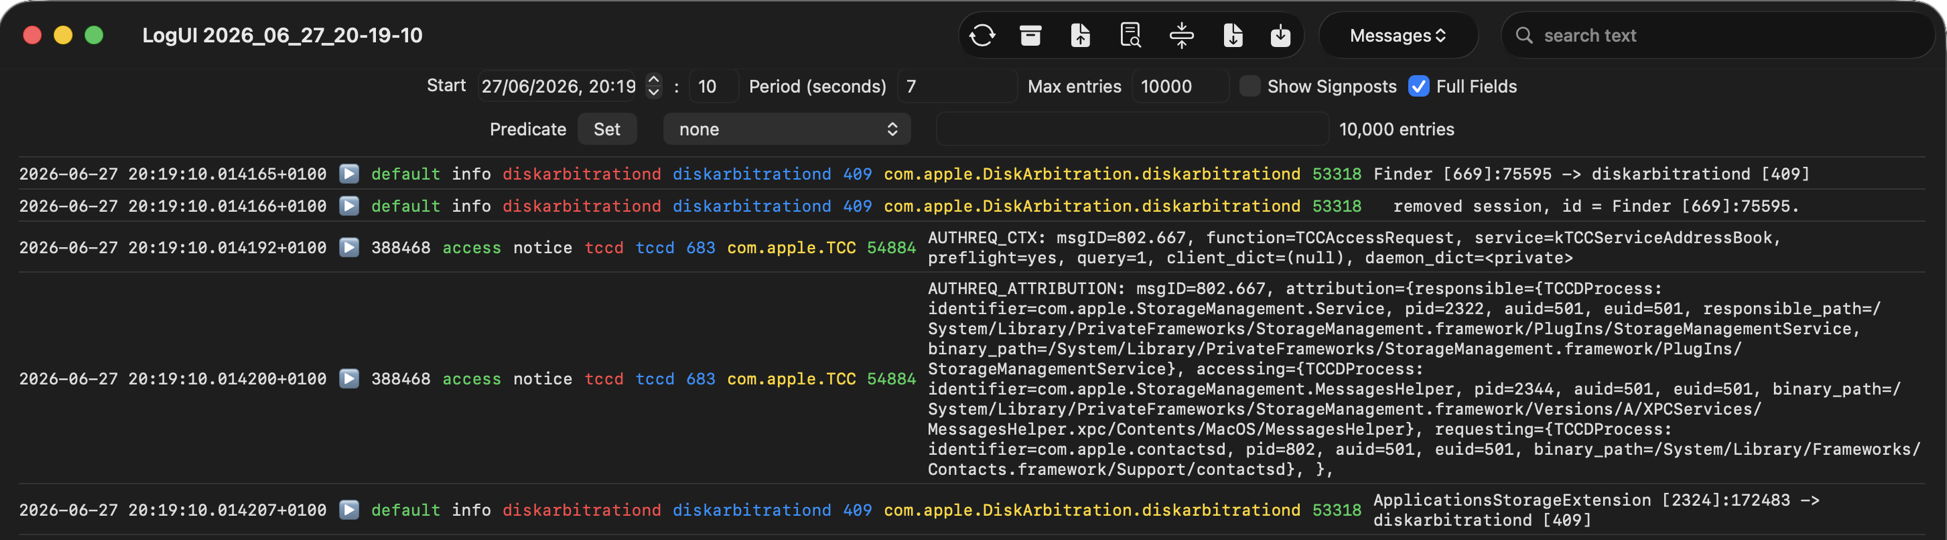
Yes, that confirms intensive log entries from diskarbitrationd, but there’s no obvious cause.
Discover patterns
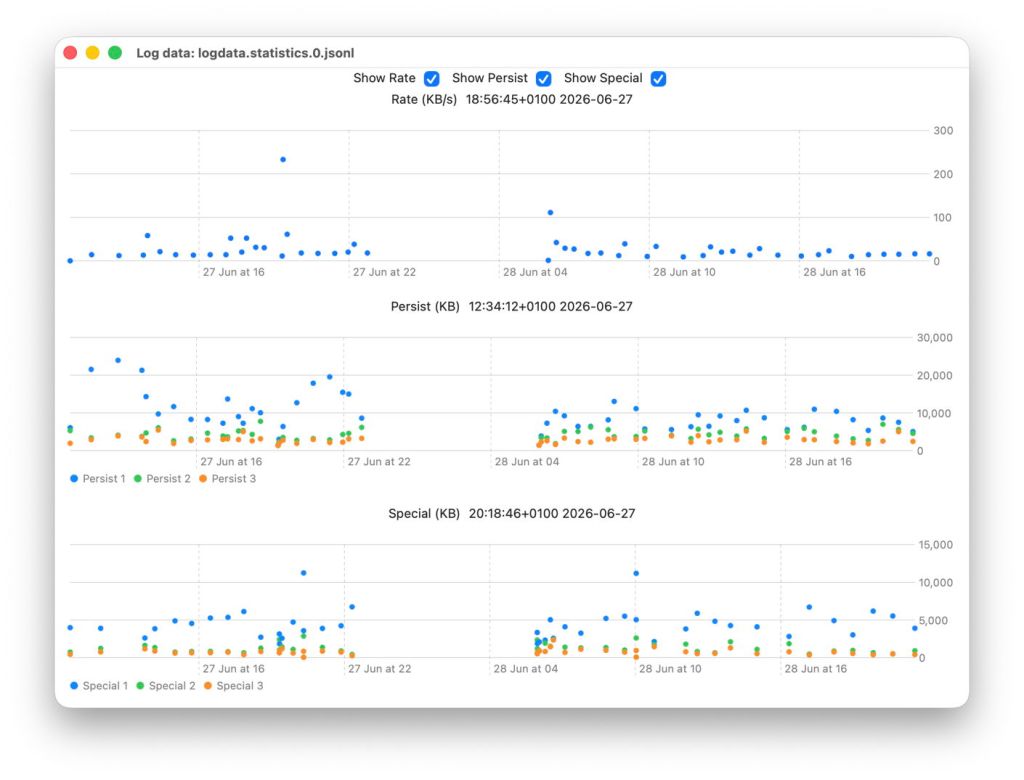
Logistician’s other charts give you a broader view over all the log files analysed in the one statistics file. To see them click the Plot all logs tool at the right end of the toolbar.
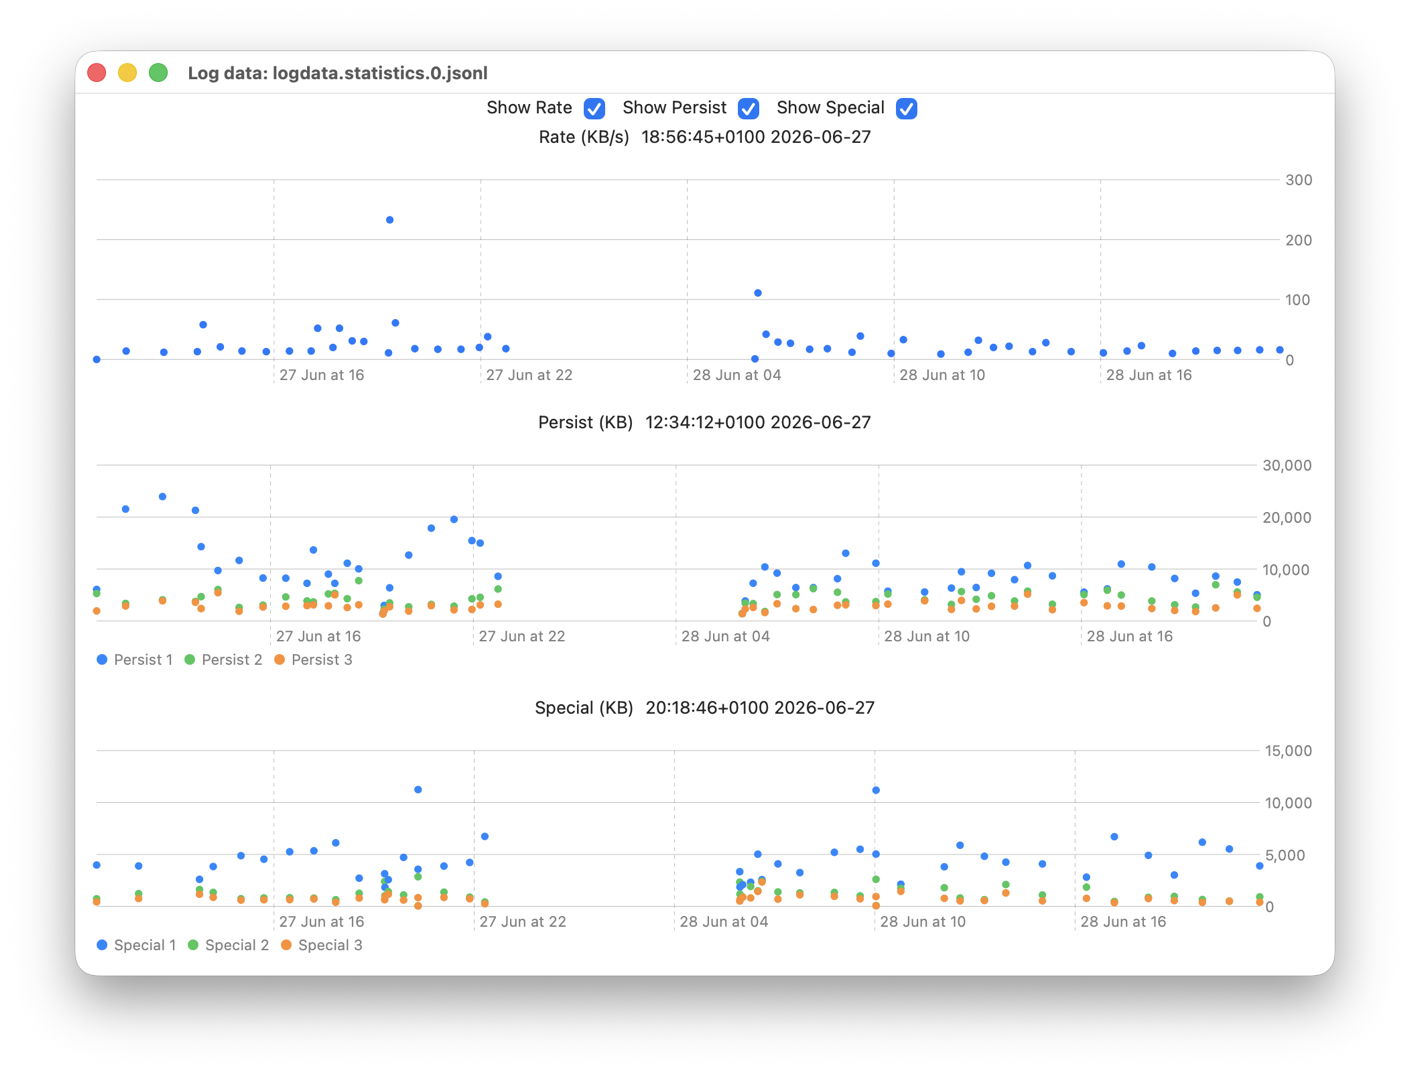
Looking through each of the log files listed by Logistician and trying to decide which merit further examination in a bar chart is time-consuming. These point plots help you choose which log files you should focus on. This window has three plots, from the top:
- Rate shows the average rate of log data written in each Persistent file. As in the other two plots, peaks are easy to identify by hovering the pointer over the dot. The text above will then give you the time and date to look at.
- Persist shows the average rates for the three processes that wrote the most data in each Persist file. Those processes are likely to differ between the points shown, but this can highlight files where there are big differences between first and second, for instance, as well as those where a lot of log data was written.
- Special shows the same for Special log files.
You may also see patterns in heavy log use appearing during each day, and may want to import the other, larger jsonl statistics file logdata.statistics.1.jsonl to see if that has similar patterns during its longer coverage. While logdata.statistics.0.jsonl usually only covers the last 36 hours or so, logdata.statistics.1.jsonl can extend back well over a month into the past, and in some Macs can cover as long as a year.
Treat causes
Although not simple, you can adjust which log entries are retained in the log, as explained in detail here. However, that’s treating the symptom rather than the cause, and its benefits are usually limited.
The most common causes you control are third-party software, particularly those listed in Login Items & Extensions in System Settings. A critical review of apps in your main Applications folder may reveal some that are old and should either be updated or removed. As those may include extensions, they can remain active even when you don’t use them. One frequent culprit is old printer support software that has been migrated from a previous Mac, even though you no longer use that printer.
Don’t expect to see major improvement in the period of log entries available, but keep at it, as the end result will be better not just for the log but for your whole Mac.
