The faster and more sophisticated the CPUs in our Macs get, the more anguished we get over their activity and performance. While there are alternatives that can display measurements of CPU activity in the menu bar and elsewhere, the most available tool is Activity Monitor. This article explains what it displays as % CPU, and how that needs careful interpretation.
Activity Monitor
The CPU view in Activity Monitor samples CPU and GPU activity over brief periods of time, displays results for the last sampling period, and updates those every 1-5 seconds. You can change the sampling period used in the Update Frequency section of the View menu, and that should normally be set to Very Often, for a period of 1 second.
This was adequate for many purposes with older M-series chips, but thread mobility in more recent chips can be expected to move threads from core to core, and between whole clusters, at a frequency similar to available sampling periods. That loses detail as to what’s going on in cores and clusters, and may give the false impression that a single thread is running simultaneously on multiple cores.
However, sampling frequency also determines how much % CPU is taken by Activity Monitor itself. While periods of 0.1 second and less are feasible with the command tool powermetrics, in Activity Monitor they would start to affect its results. If you need to see finer details, then you’ll need to use Xcode Instruments or powermetrics instead.
% CPU
The heart of the CPU view is what Activity Monitor refers to as % CPU, defined as the “percentage of CPU capability that’s being used by processes”. As far as I can tell, this is essentially the same as active residency in powermetrics, and it’s central to understanding its strengths and shortcomings.
Take a CPU core that’s running at 1 GHz. Every second it ‘ticks’ forward one billion times. If an instruction were to take just one clock cycle, then it could execute a billion of those every second. In any given second, that core is likely to spend some time idle and not executing any instructions. If it were to execute half a billion instructions in any given second, and spend the other half of the time idle, then it has an idle residency of 50% and an active residency of 50%, and that would be represented by Activity Monitor as 50% CPU. So a CPU core that’s fully occupied executing instructions, and doesn’t idle at all, has an active residency of 100%.
Expressed more formally, residency is the percentage of time a core is in a specific state. Idle residency is thus the percentage of time that core is idle and not processing instructions. Active residency is the percentage of time it isn’t idle, but is actively processing instructions. Down residency, a feature of more recent cores, is the percentage of time the core is shut down. All these are independent of the core’s frequency or clock speed.
To arrive at the % CPU figures shown in Activity Monitor, the active residency of all the CPU cores is added together. If your Mac has four P and four E cores and they’re all fully occupied with 100% active residency each, then the total % CPU shown will be 800%.
Cautions
There are two situations where this can be misleading if you’re not careful.
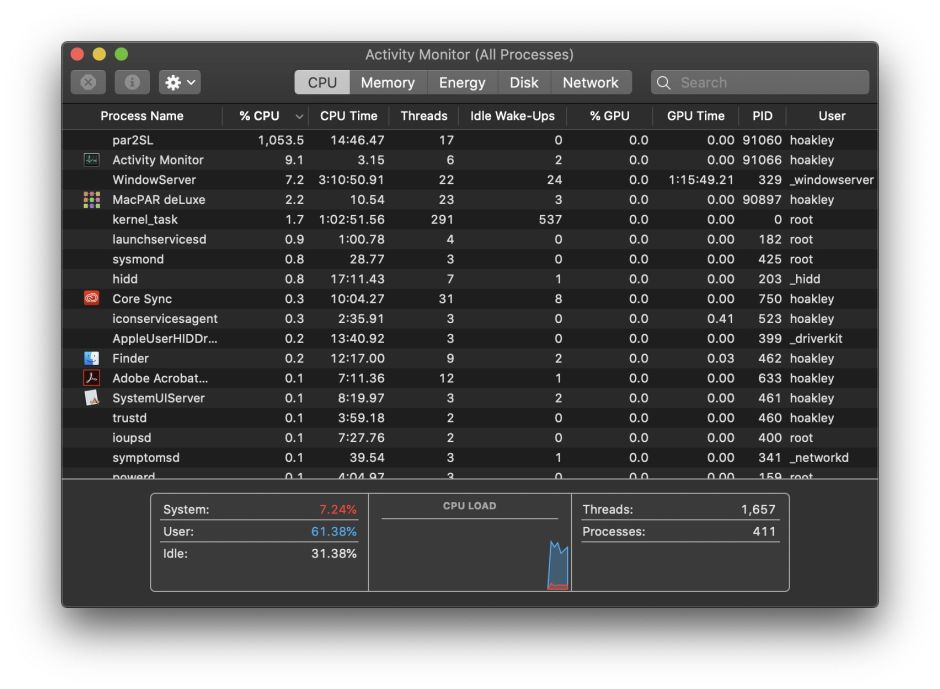
Intel CPUs feature Hyper-threading, where each physical core acquires a second, virtual core that can also run at another 100% active residency. In the CPU History window those virtual cores are shown with even numbers, and in % CPU they double the total percentage. So an 8-core Intel CPU then has a total of 16 cores, and can reach 1,600% when running flat out with Hyper-threading.

This eight-core Intel Xeon runs a short burst with full Hyper-threading, during which it gains the eight virtual cores seen on the right. According to the % CPU in Activity Monitor shown below, it was then running at over 1,000%.

The other situation affects Apple silicon chips, as their CPU cores can be run at a wide range of different frequencies under the control of macOS. However, Activity Monitor makes no allowance for their frequency. When it shows a core or total % CPU, that could be running at a frequency as low as 600 MHz in the M1, or as high as 4,512 MHz in the M4, nine times as fast. Totalling these percentages also makes no allowance for the different processing capacity of Performance and Efficiency cores.
Thus an M4 chip’s CPU cores could show a total of 400% CPU when all four E cores are running at 1,020 MHz with 100% active residency, or when four of its P cores are running at 4,512 MHz with 100% active residency. Yet the P cores would have an effective throughput of as much as six times that of the E cores. Interpreting % CPU isn’t straightforward, as nowhere does Activity Monitor provide core frequency data.

In this example from an M4 Pro, the left of each trace shows the final few seconds of four test threads running on the E cores, where they took 99 seconds to complete at a frequency of around 1,020 MHz, then in the right exactly the same four test threads completed in 23 seconds on P cores running at nearer 4,000 MHz. Note how lightly loaded the P cores appear, although they’re executing the same code at almost four times the speed.
Threads and more
For most work, you should display all the relevant columns in the CPU view, including Threads and GPU.

Threads are particularly important for processes to be able run on multiple cores simultaneously, as they’re fairly self-contained packages of executable code that macOS can allocate to a core to run. Processes that consist of just a single thread may get shuffled around between different cores, but can’t run on more than one of them at a time.
Another limitation of Activity Monitor is that it can’t tell you which threads are running on each core, or even which type of core they’re running on. When there are no other substantial threads active, you can usually guess which threads are running where by looking in the CPU History window, but when there are many active threads on both E and P cores, you can’t tell which process owns which thread.
Beachballing
A common mistake is to assume that high % CPU is somehow related to the appearance of a spinning beachball pointer. Although they can be related, they tell you different things about threads, processes and apps.

If you look in the Force Quit Applications window when an app is spinning a beachball, it doesn’t tell you anything about how much % CPU the app is taking, merely that the app is unresponsive. The most common cause of that is when the app’s main thread is too busy with a task to check in with macOS periodically.
All apps have a main thread, and many also have additional threads that handle time-consuming or computationally-intensive work. In most cases, well-written apps will avoid the main thread getting bogged down and unresponsive. One of the most common examples of this is with connections to remote sites. If those are handled in the main thread, then the whole app could be waiting for a slow-responding server to deliver its data, during which the app will be unresponsive, and macOS displays the spinning beachball.
The solution there is to handle the Internet connection asynchronously, allowing the main thread to get on with interacting with the user. When a background thread receives its data from the remote server, it can then update the main thread with that information.
Sometimes time-consuming tasks have to be handled in the main thread, and there may be no way to avoid unresponsiveness, but those are unusual if not exceptional now. At the same time, the appearance of the spinning beachball doesn’t mean that app has crashed or frozen, and it may well just be trying to get on with its work as well as it can in the circumstances.
It’s easy for an app to spin the beachball when it’s taking far less than 100% CPU, and many apps that can take over 500% in the right circumstances should remain fully responsive throughout.
Key points
- % CPU is the percentage of time that CPU core isn’t idle, but is actively processing instructions. It takes no account of core type or frequency.
- Total % CPU is the total of all individual values for CPU cores, and a maximum of 100% times the number of cores. For a chip with 8 cores, maximum total % CPU is 800%.
- This can become confused in Intel CPUs with Hyper-threading, as that adds another set of virtual cores.
- Apple silicon CPU cores operate at a wide range of frequencies, which aren’t taken into account in % CPU.
- High % CPU is completely different from what happens when an app spins the beachball, which is the result of the app’s main thread becoming unresponsive.
- An app can spin the beachball when its total % CPU is relatively low, and an app with a high total % CPU may remain highly responsive.
