
A lot of the code that’s most critical to performance now uses specialised vector and matrix units for acceleration. This article compares the vector processing unit built into the CPU cores in Apple’s M1 Max and M3 Pro chips, with particular emphasis on performance and energy use. It relies on explanations of the methods used in my previous articles in this series:
If you’re not already familiar with the first of those, I recommend that you read it before this article, or you may well be mystified.
Methods
I have been using two tests within my GUI wrapper app to assess maximum throughput of the NEON units in Apple’s CPU cores: one coded in assembly language, the other by calling the simd_dot() function in Apple’s Accelerate library. Test results to date have been almost identical, but as I know exactly what code is run in my own implementation of the dot product, I used that throughout these tests. As you’ll see in the source code, each loop consists of four NEON vector instructions, an FMUL, two FADDP and a FADD instruction, all performed using 32-bit 4-lane operands and register access alone. In the real world, developers are far more likely to use the Accelerate library, which delivers optimal performance across the full range of Mac hardware, and is written by engineers who really do know what they’re doing.
NEON units in cores were loaded with 1-6 threads each running a set number of tight loops of the code given in the Appendix. Time to complete threads was measured using Mach Absolute Time and reported in the wrapper app. During each test, CPU core performance was measured using powermetrics, which sampled for periods of 0.1 seconds over a total of 5-15 seconds.
Performance
Each thread was executed effectively as a single core with 100% active residency. Core frequency control proved complex:
- In the P cores of the M1 Max, frequency was set according to the number of threads running in that cluster. For one thread, at 3228 MHz, for two at 3132 MHz, and for three or four at 3026 MHz. For example, when six threads were run in two four-core clusters, the cores in the first cluster were all fully occupied by the test threads and ran at 3026 MHz, while the cores in the second cluster running the remaining two threads ran at 3132 MHz.
- In the P cores of the M3 Pro, frequency was set at 3624 MHz when running 1-4 threads, and 3576 MHz for 5 or 6 threads.
- In the two E cores of the M1 Max, a single thread was run at 972 MHz, and two threads at 2064 MHz. This is a behaviour that I have described previously.
- In the six E cores of the M3 Pro, as the threads were being run at low QoS, core frequency remained at 744 MHz throughout.
Thankfully, the results are considerably simpler than frequency controls.
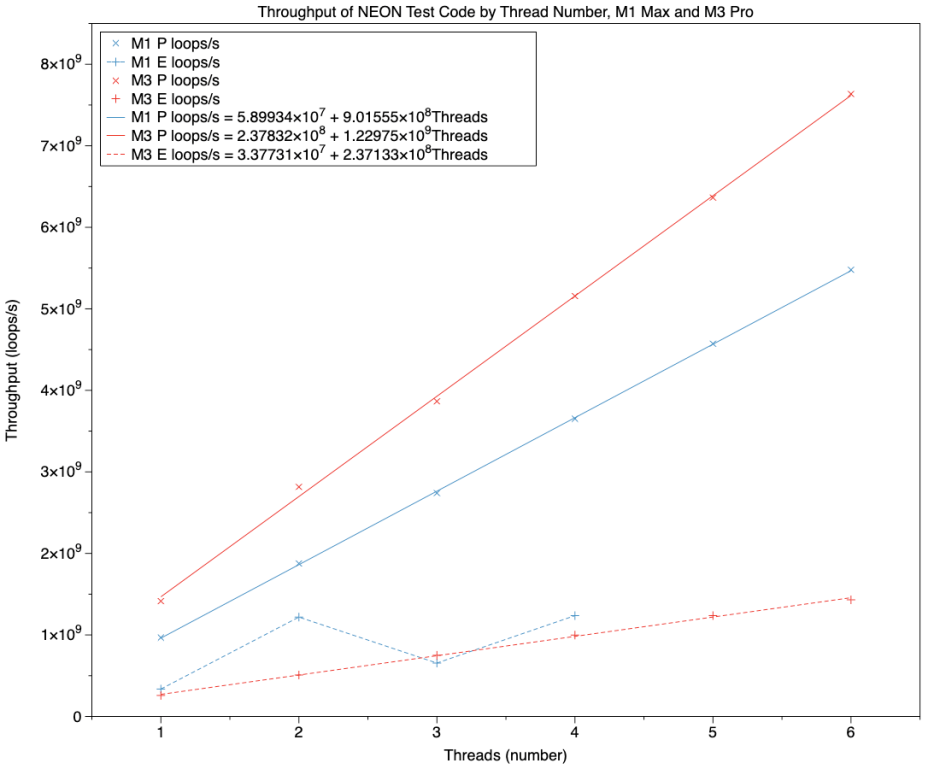
This chart summarises throughput in terms of the total number of loops completed per second across all threads, against the number of threads, and effectively the number of cores. Results for cores in the M1 Max are shown in blue, and for the M3 Pro in red. Solid regression lines with x points are for P cores, and broken lines with + points for E cores.
Taking the P cores first, regression lines fitted both sets of results very closely. The equations of those lines are:
- throughput = 5.9 x 10^7 + (9.0 x 10^8 * number of threads) for M1 Max
- throughput = 2.4 x 10^8 + (1.2 x 10^9 * number of threads) for M3 Pro
Over those results, performance of the M3 Pro P cores was about 140% of those of the M1 Max, although the ratio of coefficients in the regression equations was only 133%. Because of the complex frequency control, no simple percentage can be given to express the frequency advantage of the M3 P cores, but it’s around 120% as used across the tests.
This confirms that NEON performance in the P cores of the M3 Pro is significantly better than would be expected on the basis of frequency differences alone.
On the E cores, the M1 Max shows its idiosyncratic behaviour, swinging from performance close to that of the M3 Pro when at its lower frequency, and performance closer to that of a single M3 P core when the two-core E cluster is running at its higher frequency. Although this works well when both E cores are well loaded, performance drops off markedly when frequency is reduced.
The six E cores of the M3 Pro are more predictable and consistent, their results fitting the line
throughput = 3.4 x 10^7 + (2.4 x 10^8 * number of threads)
which values each E core at around 20% of an M3 P core without taking frequency into account. As those E cores are running at 744 MHz, against a P core at 3576 MHz or more, frequency alone can account for this performance difference.
Power
Given that the P cores in the M3 Pro run faster and process loops disproportionately faster than those in the M1 Max, you might expect them to draw more power for each thread they run.
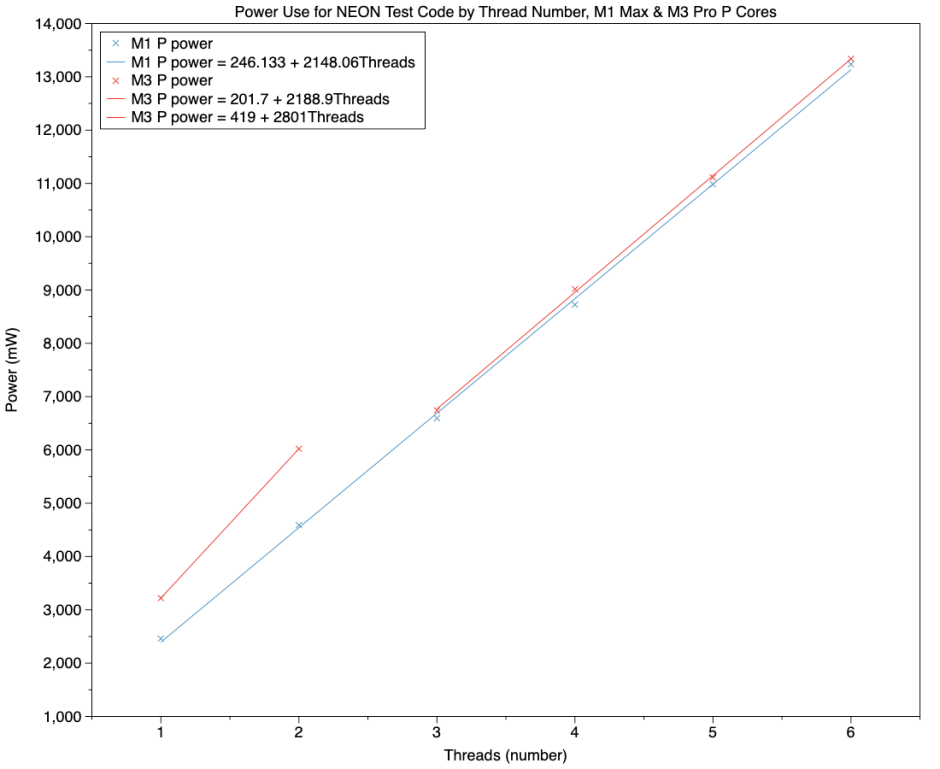
This chart shows results for the P cores in an M1 Max (blue) and M3 Pro (red). At 1 or 2 threads (cores), the M3 Pro does draw significantly more power, as shown in the short line segment. With two P cores, that amounts to a difference of about 1.5 W. However, with three and more cores, power use is almost identical between M1 Max and M3 Pro. This can’t be accounted for simply by frequency differences: with a single thread, the M1 Max’s P core is running at 3228 MHz, and that of the M3 Pro at 3624 MHz, a ratio of 1.12 for a power ratio of 1.3.
Most significantly, these lines demonstrate that the M3 Pro is delivering 140% performance relative to the M1 Max while using almost identical power, over three and more cores.
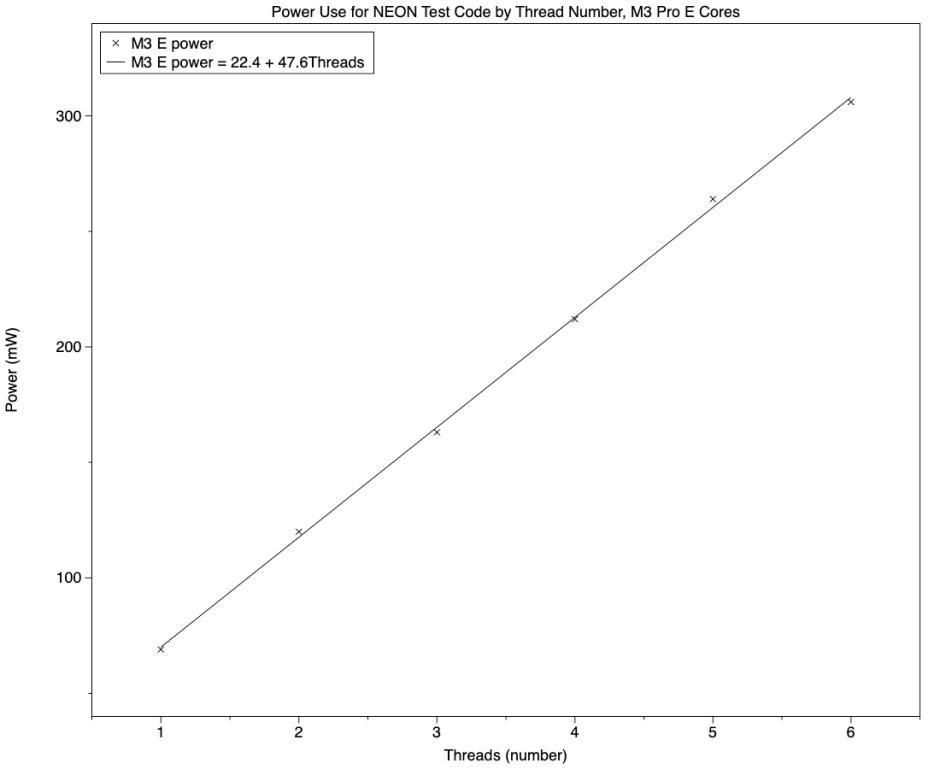
Comparing E cores is once again limited by the small cluster size and idiosyncrasies of the M1 Max. This used 68 mW when running one E core at low frequency, and 404 mW when running both cores at high frequency. The chart shows the greater consistency of the E cores in the M3 Pro, which used 69 mW with a single thread, and 120 mW with two threads, albeit at lower throughput than in the M1 Max.
Conclusions
- When running threads containing code for the NEON vector processor, frequency control is complex, and depends on the number of active cores in a cluster. This is most complex in the M1 Max.
- Overall NEON performance of the P cores in the M3 Pro is about 140% of that in the M1 Max, more than can be accounted for by frequency differences. As suggested by Maynard Handley (in a comment to a previous article), this could be the result of instruction reordering while in the scheduling pipeline.
- This improved performance is delivered without any increase in power use, on three and more active cores. With smaller numbers of cores, though, the M3 Pro does use significantly more power when running NEON code.
- Although the M1 Pro and Max use an ingenious solution to get better NEON performance from their two E cores, those in the M3 Pro are more consistent, capacious and flexible.
Performance libraries such as Apple’s Accelerate extend far beyond basic vector processing, and use other computational features of M-series chips, including Apple’s custom AMX matrix processor. That’s my target for the next article in this series.
Appendix: Source code
_neondotprod:

STR     LR, [SP, #-16]!

LDP     Q2, Q3, [X0]

FADD    V4.4S, V2.4S, V2.4S

MOV     X4, X1

ADD     X4, X4, #1

dp_while_loop:

SUBS    X4, X4, #1

B.EQ    dp_while_done

FMUL    V1.4S, V2.4S, V3.4S

FADDP   V0.4S, V1.4S, V1.4S

FADDP   V0.4S, V0.4S, V0.4S

FADD    V2.4S, V2.4S, V4.4S

B       dp_while_loop

dp_while_done:

FMOV    S0, S2

LDR     LR, [SP], #16

RET
