
The underlying principle in the design of CPUs in Apple’s M-series chips is that Macs run some tasks that benefit most from high performance cores, and others that can be run in the background on cores that are more energy-efficient. Yet most reviews and assessments of new Macs place emphasis on performance, and pay relatively little attention to efficiency. While there are a great many reports of Geekbench results for M3 chips, I don’t even know of an efficiency benchmark that has been used to compare them. This article builds on the testing methods and results in my previous article in an effort to gain insight into power use and energy efficiency of the M3 Pro, and by extension to other M3 chips. If you’re not already familiar with that article, I recommend that you read it first, or you’ll be mystified by this one.
Power and energy
As its name suggests, the command tool powermetrics provides averaged estimates of power use for all the CPU cores (also, separately, the GPU and neural engine) in milliwatts (mW); power is the rate of energy use, here in millijoules (mJ) per second. While power is important in determining heat output and cooling requirements, it’s energy use that determines discharge of the battery in a notebook. If a thread only uses half the power when run on an efficiency (E) core, but takes more than twice as long, the CPU should run cooler, but it will drain the battery after the completion of fewer of those threads. When time of execution is taken into account, energy efficiency may not be as impressive as power measurements might suggest.
Methods
The same core loading tests and measurements detailed in the previous article were used to measure total CPU power averaged over 0.1 second sampling periods, when running intensive in-core loops of floating point arithmetic. In each case, 200 million loops were run and timed, at either of two QoS levels of 9 and 33. In the former, macOS confines the threads to the E cores, while threads with the higher QoS are run preferentially on P cores, then on E cores when no P core is available.
For all measurements made during a load test, median power use was determined. Although every effort was made to minimise the running of other threads during these tests, inevitably some were run briefly by macOS. As power values aren’t normally-distributed, averages are poor estimators, but medians proved more robust. Given the median power, number of threads (functionally the same as the number of cores used), and the time to complete all threads in a given test, total energy was calculated, also expressed as energy per thread/core. QoS settings and numbers of threads were assessed in M3 Pro CPU cores in three sets:
- 1-6 P cores running at high frequency of about 3624 MHz;
- 1-6 E cores running threads at low QoS, thus at low frequency of about 744 MHz;
- 1-4 E cores recruited to run threads at high QoS, thus at high frequency of about 2748 MHz, as overflow when P cores were fully occupied.
P cores
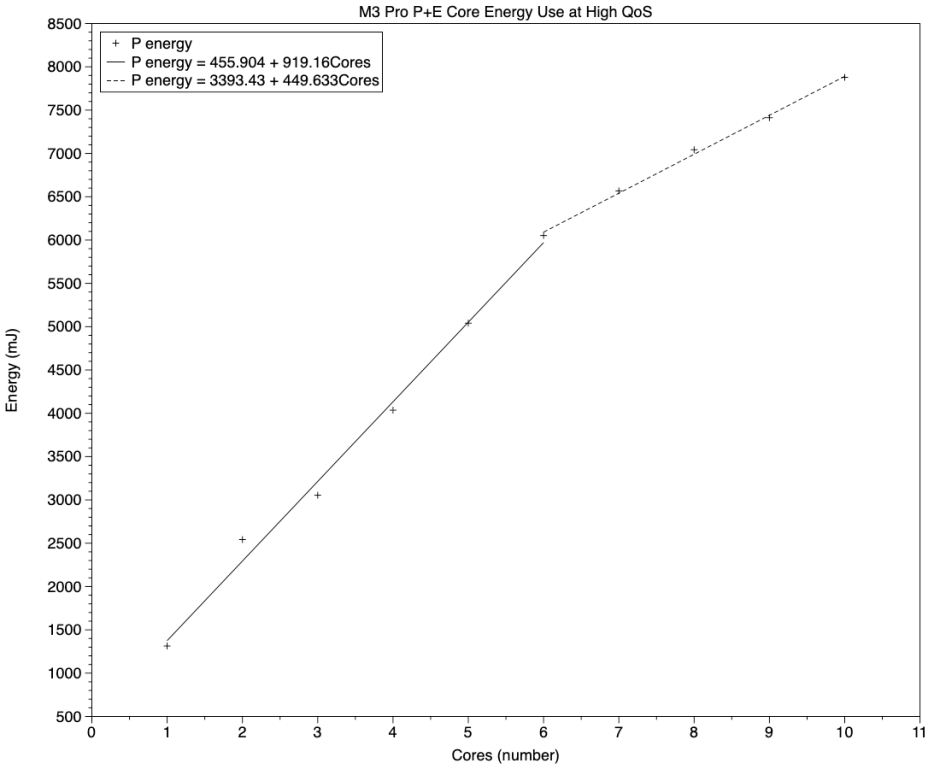
As shown in the chart above, there was a roughly linear relationship between total CPU energy use for the test and the number of threads/cores, for core counts of 1-6. The line of best fit has the equation
energy = 455.9 + (919.2 * number of cores)
This indicates that there’s an overhead of about 450 mJ for using the P cluster, with an additional cost of about 920 mJ for each P core used to run a test thread.
E cores
With more than six high QoS threads running, additional threads were allocated to E cores, whose frequency was increased to about 2748 MHz so that they ran threads only a little slower than P cores. The energy cost of each thread run on an E core was about 450 mJ, according to the linear regression.
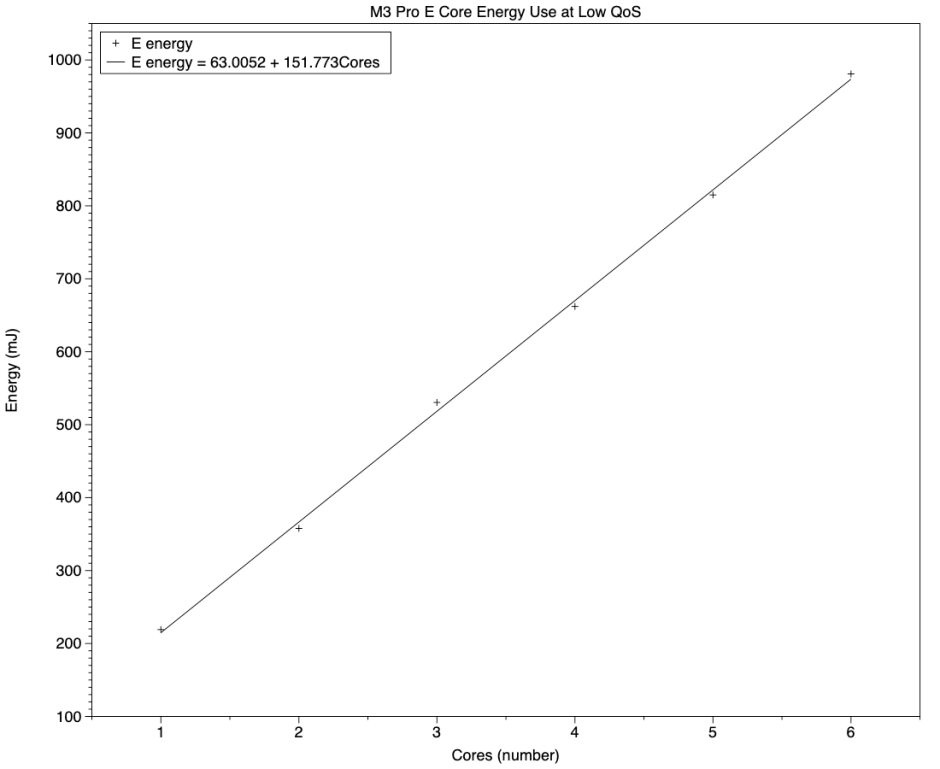
When running low QoS threads at low frequency, energy use by the CPU showed a strongly linear relationship, with the line of best fit having the equation
energy = 63.0 + (151.8 * number of cores)
This indicates that there’s an overhead of about 60 mJ for using the E cluster, with an additional cost of about 150 mJ for each E core used to run a test thread at low frequency.
Variation
To assess departure from the efficiency predicted using linear regressions, energy use was calculated for each P and E core tested, and those per-core values are shown in the chart below.
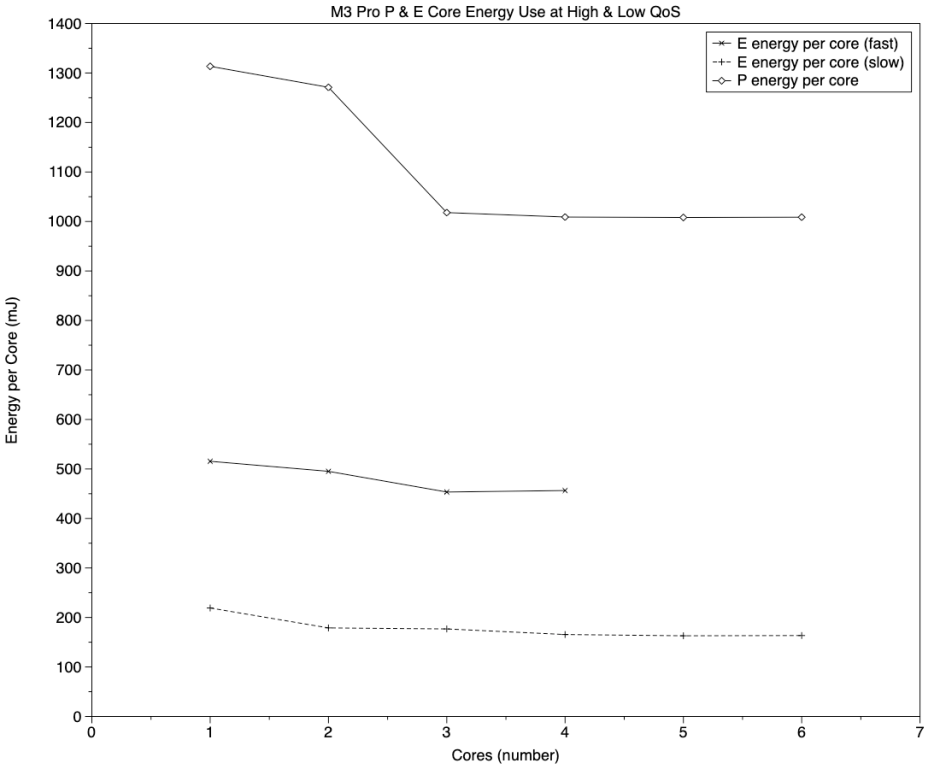
The upper solid line with open diamond points shows results for P cores; the solid line below that with x points shows high QoS threads running at high frequency on E cores; the bottom broken line with + points shows low QoS threads running at low frequency on E cores.
In each case, energy used per core is highest with a single core; thereafter it falls slightly, although there’s a greater reduction when going from 2 to 3 P cores. That reduction isn’t reflected in other performance measurements on the P cores. In fact, there was a small fall in frequency, but when going from 4 to 5 cores, with 1-4 cores running at 3624 MHz and 5-10 cores at 3576 MHz.
This chart gives a good visual comparison of the differences between energy use of the two core types, and for the E cores in high and low frequency modes.
Comparison with M1 Pro
Comparing energy use of the two E cores in the M1 Pro chip is fraught, because in those tests it either runs in low frequency single-core mode, or in high-frequency two-core mode. Using the same method, the latter uses about 426 mJ for a two-core floating point test, giving a per-core energy use of about 213 mJ. That’s higher than the M3 Pro E core at low frequency, but lower than high frequency.
The P cores in the M1 Pro show similar energy use in lower numbers, but that doesn’t fall with increasing numbers of P cores in use. Energy use per core in the M1 Pro remained at 1272 mJ when all four cores of its first P cluster were tested. In comparison, M3 Pro P cores had similar energy use per core when one and two cores were tested, but that fell to 1008 mJ with four to six cores. Despite their higher frequency, M3 P cores thus appear more energy efficient than M1 P cores.
Predicting energy use
The regression equations above can be used to estimate energy use on other M3 CPU configurations, thus to give an idea of their merits in terms of energy efficiency. Although these are based on 200 million loops of the floating point test used here, they should generalise well for other scalar operations, but not for vector or matrix functions, which I’ll examine in the future.
To demonstrate this approach, I first predict one of the measurements made during these tests, for eight high QoS tests run on an M3 Pro:
- 450 mJ overhead for the P cluster, plus
- 6 x 920 mJ for the P cores, plus
- 2 x 450 mJ for the E cores, equals
- a total of 6870 mJ.
The measured energy use for that test was 7042 mJ.
The same test load run on an M3 Max would be predicted as
- 900 mJ overhead for the two P clusters, plus
- 8 x 920 mJ for the P cores, equals
- a total of 8260 mJ,
a predicted difference of 1390 mJ for a performance gain in the test of less than 10%, with a time of 1.2 s (M3 Pro) reduced to 1.1 s (M3 Max). Overflowing the first P cluster in an M3 Max is thus energy-expensive when compared with an M3 Pro, and delivers relatively small performance gains until more than ten cores are required, when the M3 Pro runs out of E cores it can run at high frequency to accommodate high QoS threads.
The same test load run on an M1 Pro or Max drew power of 7625 mW for a period of 1.338 seconds, giving a total energy use of 10,200 mJ at 90% of the speed of the M3 Pro. That demonstrates how the M3 Pro comfortably outperforms both M1 Pro and Max while saving more than 3 J of energy.
Summary of energy model for M3 Pro CPU
- For low QoS threads run on E cores alone: 60 mJ cluster overhead + 150 mJ per core.
- For high QoS threads run on P cores alone: 450 mJ cluster overhead + 920 mJ per core.
- For high QoS threads that overflow and run on E cores: 450 mJ per core, in addition to P cores.
These have been fitted for 200 million loops of the floating point test used here, but should hold for other scalar computation.
