

Late last year, I drew attention to a problem with the log in many, perhaps most, Macs running Ventura: if your Mac is running, and not asleep, for long periods, it fills its log up to the point where this limits its usefulness. This first became apparent when checking the log for XProtect Remediator scan reports; as these are normally run once a day, if your Mac’s log can’t look back at least 24 hours, then it may not be possible to check those scans.
This problem arises because, unlike most log systems, macOS doesn’t keep old logs for a fixed period, but limits the size of the log folders stored on disk instead. The more log entries that are written to those files each hour, the shorter the period they can cover. When the Unified log was brand new, in macOS Sierra, most Macs retained complete logs for 20 days or more. Since then, macOS has been writing more and more to the log, so shortening the period the log can cover.
Late last year, I discovered some Macs, including one of mine, whose logs went back significantly less than 24 hours, and in a few extreme cases for less than 12.
There is a solution, though: you can change the log’s preferences to mute entries from specific subsystems. Currently, in Ventura 13.2, one of the major culprits is Bluetooth, in the subsystem com.apple.bluetooth, which is running riot in the log, writing copious entries even when everything seems to be working fine. So one good plan might be to mute com.apple.bluetooth in the log’s preferences.
Even with the likes of Ulbow, it can be hard to establish which subsystems are the chattiest, and to assess whether muting them has been a success. So, inspired by Don’s recent experiences, I have a new version of Ulbow to help you with this and other problems.
Assessment
Although you can use Ulbow’s new Frequency view with other settings, if you want to clean your log up I suggest you follow these steps to assess it. You’ll need to do this with Enable Chart View ticked in the Ulbow menu, as the Frequency view relies on the same log analysis performed to support charts.
In the View menu, untick Get info messages and Get Signposts, as we’re primarily concerned here with regular log messages. Also ensure that Show Signposts and Activities are unticked. As we’ll be fetching quite a few log entries, I recommend that you Limit entries shown throughout.

Set a Period of 5-10 minutes to start with, at a time when your Mac wasn’t exceptionally active (such as during startup), but was awake the whole time. With none set for the Predicate, click on Get log, aiming to see the first number in parentheses, giving the total number of log entries obtained, between around 100,000 and 200,000, and no more than 400,000 at most.
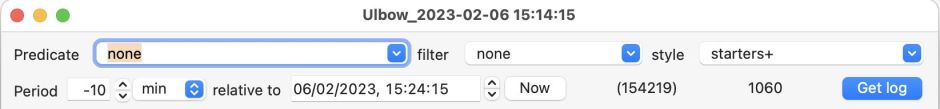
Chart and Frequency views rely on a second background parsing of all the log entries, so wait a few seconds after the entries appear in the log view below. Then use the newly enabled Open Frequency command in the Window menu to open this new view.

There you’ll see a list of all the subsystems found in that log extract, with the number of log entries given for each, and in descending order of frequency. In this case, the most frequent had no subsystem given, and the most used subsystem was com.apple.containermanager, with 14,202 log entries in the period.
Treatment
If you want to, you can craft your own property lists to mute the subsystems of your choice, or use the log config command in Terminal to do that for you. Ulbow, though, now makes that easier still.
The popup menu at the top of the Frequency view lists all the subsystems found in that log excerpt in alphabetical order. Select the one you want to mute, and click the Save button.

Ulbow then creates the appropriate property list to mute that subsystem, ready for you to install in the Preferences folder. Because this has to go in a protected folder, drag and drop it into /Library/Preferences/Logging/Subsystems, where you’ll be required to authenticate (which is why you shouldn’t try to save it there directly).
Carry on using your Mac as normal, and an hour or so later check another 5-10 minute section of log, written well after you muted the subsystem(s), and you should at least see a marked reduction in the log entries from those subsystems.
Bluetooth woes
My own experience of using this with Ventura 13.1 was near-instant relief, but 13.2 doesn’t appear as well behaved. Despite trying to mute com.apple.bluetooth, and another subsystem, they continue to write to the log, although at a lower frequency. Muting other subsystems works better, so I’m unsure whether this is just a bug in 13.2, or something else.
Ulbow and huge logs
I get occasional reports of Ulbow crashing when trying to work with huge log extracts, and experienced one myself while testing this new version. The underlying cause is trying to work with too many log entries. At first I was keen to enforce a limit within Ulbow, but on further testing and reflection, I’m now reluctant to do so.
At times, Ulbow can work perfectly well, including its Frequency and Chart views, with around 750,000 log entries. At other times, it becomes extremely sluggish or crashes when there are ‘only’ 500,000. To safely prevent crashing, I’d have to set an upper limit of around 400,000, even though I know there are times when it will work fine with many more.
Perhaps it’s best to appreciate that Ulbow should be stable and, given a reasonably capable Mac, handle responsively with up to 200,000 log entries. If you take it above that, the risk of it crashing starts to increase, and more than 500,000 is definitely a gamble. I hate to stop anyone pushing Ulbow where it can go, so would rather not build in an arbitrary limit unless I have to.
Update
Ulbow version 1.10, with its new Frequency view, and running on High Sierra to Ventura, Intel and Apple silicon, is now available from here: ulbow110 (updated to latest version 1.10)
from Downloads above, from its Product Page, and via its auto-update mechanism.
I hope you find it useful.
