
After the limitations of the bundled log browser, Console, the biggest problem in accessing the Unified log is navigating its copious entries. Even when you already know exactly what you’re looking for, it can take time and patience to locate entries of interest. More often than not you have limited clues, and it’s worse than looking for a needle in a haystack. This article offers some practical suggestions.
Time
Each entry in the log is accompanied by two timestamps, one in conventional format such as
2022-07-25 08:33:12.000524+0100
the other given in Mach ‘ticks’, usually a very large integer such as 384195265038867. The latter can be useful when looking at very small time intervals, and I have used it when measuring log performance, but the full timestamp is more generally useful.
One common catch when using the timestamp is timezone correction. In the example given, the timestamp is given in local time after applying the correction given at the end of the timestamp, in this case adding an hour to GMT to arrive at local summer time. That becomes complicated with larger corrections for local time, and when summer time starts and ends. Times entered in Ulbow’s controls are normally expressed in local time, as given in the timestamps recorded in log entries. On the rare occasions when that doesn’t work, you might need to apply a manual correction when entering the time. That should be obvious from the timestamps on the log entries returned.
Rather than requiring you to laboriously set two times to determine the start and end of each log extract, Ulbow uses one time, and you set the period to or from that moment. For instance, if the time is set at
2022-07-25 08:30:00
then a period of -1 minute will obtain log entries between 08:29:00 and 08:30:00, and (+)1 minute for entries between 08:30:00 and 08:31:00.
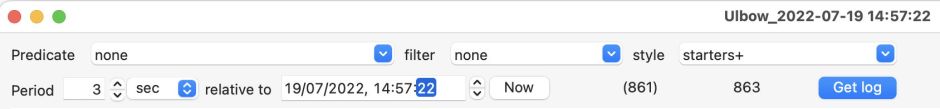
When you have multiple windows open in Ulbow, it’s simple to copy and paste time settings between them: just select any of the items within one time and copy it. You can then paste the whole of that date and time into another window. This doesn’t work with other apps and places, because of weak standardisation in ways of expressing time.
Sadly, we often don’t know to the nearest second when an event happened, and browsing the whole log for several minutes will quickly drive you crazy. In those circumstances, it’s better to combine the use of shorter time periods with other methods to reduce the number of log entries shown, such as specifying a subsystem. A simple example is looking at the last hour of log entries from the Time Machine backup subsystem com.apple.TimeMachine, which is likely to return just 50-100 entries in all.
Another useful technique is a sliding time window: to search quickly over a longer interval, use a relatively short period, then work steadily backwards or forwards in time until you think you have a better idea of the exact time of the event.
Boot and other major system events
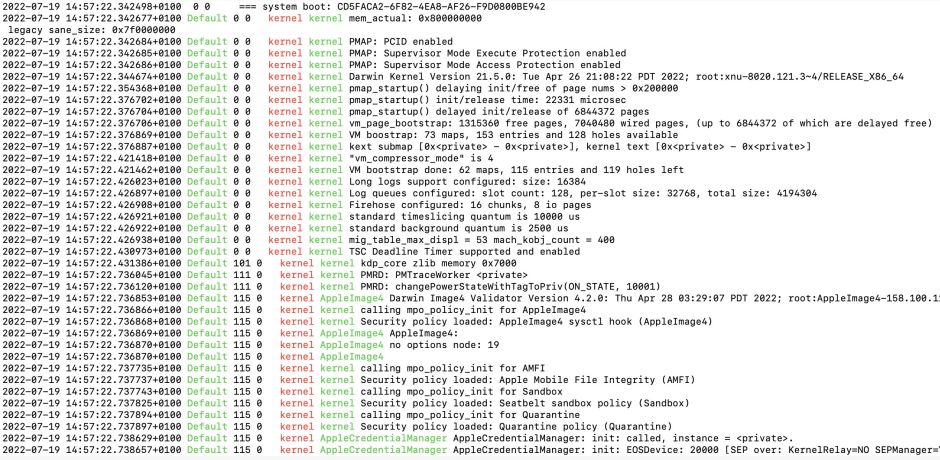
Some major system events have distinctive log entries you can use to discover them. As I demonstrated in the previous article, the start of system boot is marked by an entry containing
=== system boot:
followed by the UUID of that boot event, which you can use Mints to find for you over the previous 24 hours.
=== system wallclock time adjusted
accompanies other major events, and normally precedes shutdown, and
PMRD: System Wake
can mark the start of waking from sleep. Unfortunately these can change according to macOS version, making them frustrating. When you’re investigating a particular subsystem, look for similar landmarks you can use.
Activities
Some significant events recorded in the log are easy to find, as they’re classified as activities. A common example useful for locating the time that you clicked or double-clicked an item in the Finder is the activity recording that action. This enables you to identify when, for instance, an app or document is opened from the Finder.
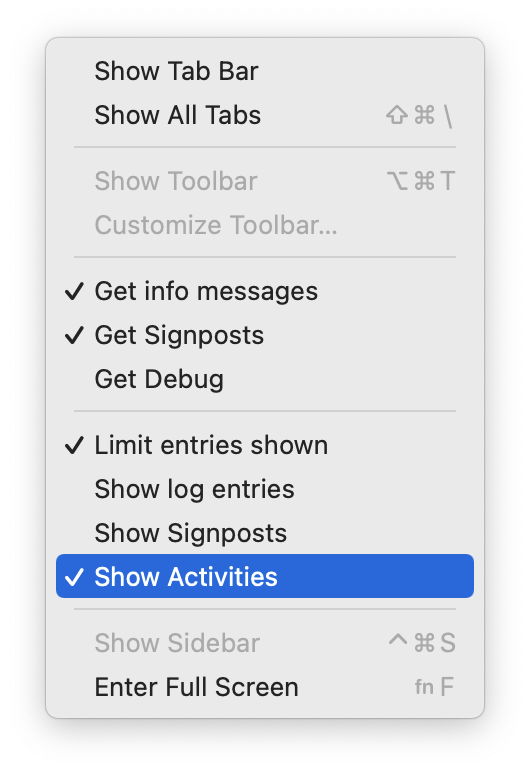
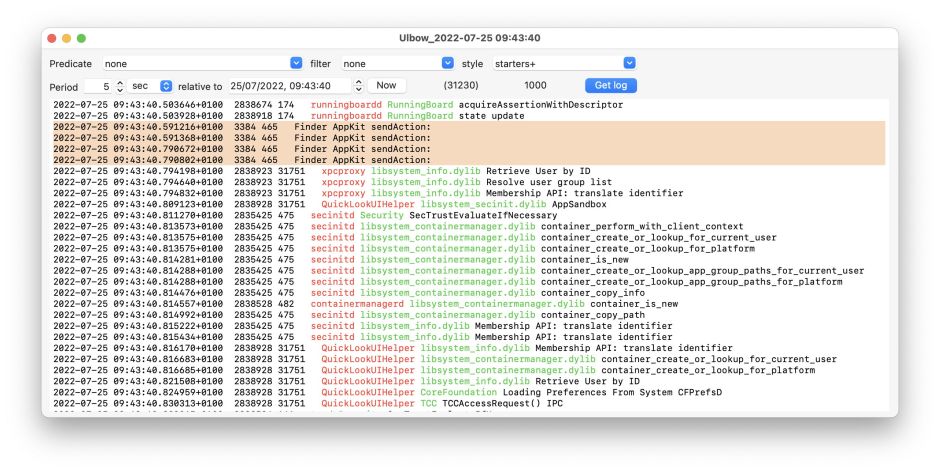
First set the time and period to capture the event. Then in the View menu, tick Show Activities, but untick Show Log Entries and Show Signposts. Then click on Get log: the extract returned will contain only activities, among them being multiple short entries containing just
Finder AppKit sendAction:
which represent the click/tap activity. Usually each click/tap results in two identical entries, so a double-click results in four in total. Once you know the time of those, you can narrow the period to start just before the second of those events. Other activities can also prove useful, and, as activities are far less common than regular log entries, they make browsing much simpler.
Subsystem
Of all the fields you can use in a search predicate, by far the most useful is the subsystem. These should be given in standard reverse-URL format such as com.apple.bluetooth, and can consist of three or four elements, such as com.apple.xpc.remote.
Subsystems come but seldom seem to go, and since they appeared in Sierra they have proliferated greatly. Apple doesn’t provide any list or even guidance as to the subsystems it uses. I list some of them in the Help references to Mints and Ulbow, but in general the best way to discover them is in detailed accounts of different features in blogs like this.
You can work out useful subsystems in Ulbow by trying them. The Predicate combo-box at the top left accepts direct text entry, so you can test ideas out there. Each should be entered in the form
subsystem == "com.apple.subsystemname"
taking care to ensure that the double-quotes used are plain and not typographic. However, this requires that you click Get log each time to search the log using that predicate.
Find
Ulbow also offers full-text search of the contents of the current log extract, which is particularly useful when you know a specific series of characters which is distinctive, such as the name of an app. To get the best from this, you may want to turn off the default limit to the number of log entries shown, by unticking the Limit entries shown command in the View menu, then opening the Find window with the Find/Find… command in the Edit menu.
Filtering and searching by predicate, filter, and Find are quite different.
Predicates are applied to specific fields in the log entries, and determine which are included in the log extract you work with. Setting
subsystem == "com.apple.runningboard"
means that every entry in the log extract obtained will have a subsystem field matching what you set. You can use this to extract entries with specific characters in the message field, for example with a predicate of
eventMessage CONTAINS[c] "error"
to include only those entries whose eventMessage field contains the characters error, which isn’t case-sensitive here because of the [c] in the predicate.
Filters are unique to Ulbow (and Consolation), as they don’t alter which log entries are included in the extract, but filter those shown according to characters appearing in each entry’s eventMessage. Instead of using a predicate to find entries with error in the eventMessage, you can use a filter set to
error
which then only displays those log entries with that word in them.
Find searches all the displayed log text for the characters you enter. It doesn’t affect which entries are included in the log extract, or hide those entries which don’t contain the search term.
To see the difference between these, try each of these separately over a period of a minute or two:
subsystem == "com.apple.runningboard"as a predicate;eventMessage CONTAINS[c] "runningboard"as a predicate;runningboardas a filter, with no predicate;runningboardin the Find window, with no predicate or filter.
Remember that when you change the predicate, you need to click the Get log button to get a fresh log extract, but you don’t need to do that when you’ve only changed the filter or are using Find.
Chart
The last navigational aid for this article is another unique to Ulbow, and one of its most powerful features: a bar chart showing the frequency of different log entries over the time of the log extract.
To see how this works, first check that Enable Chart View is ticked in the Ulbow menu, then obtain a log extract of some size, such as 5,000 entries over a period of seconds up to a minute or so. Now use the Open Chart command in the Window menu.
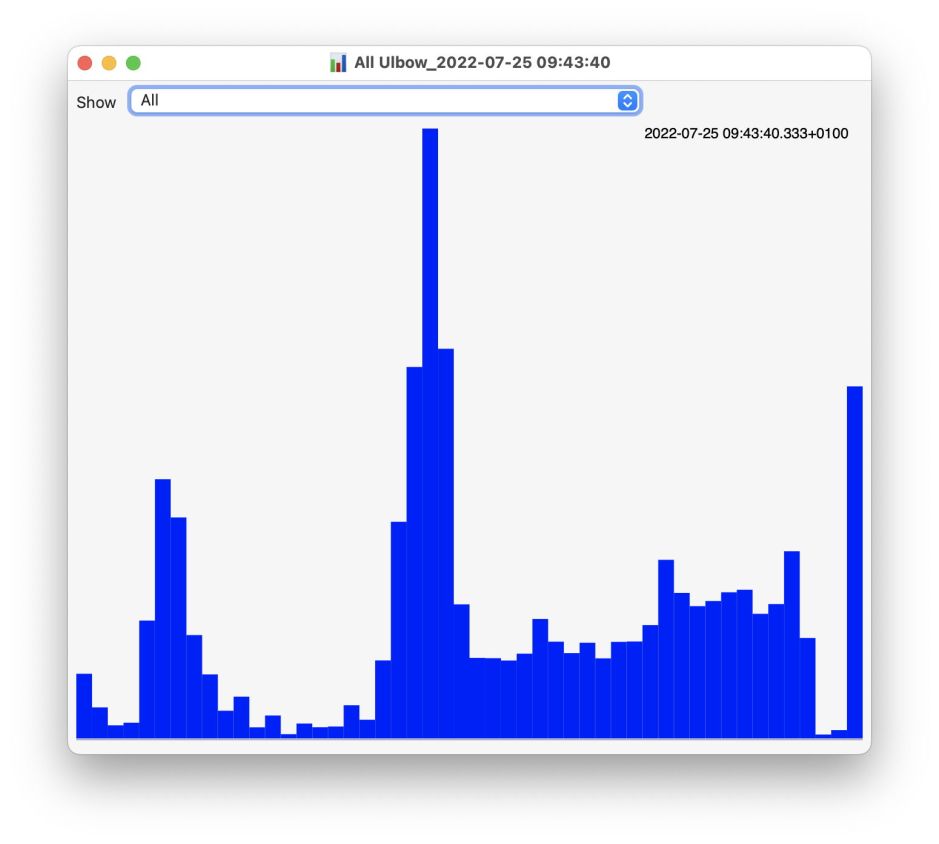
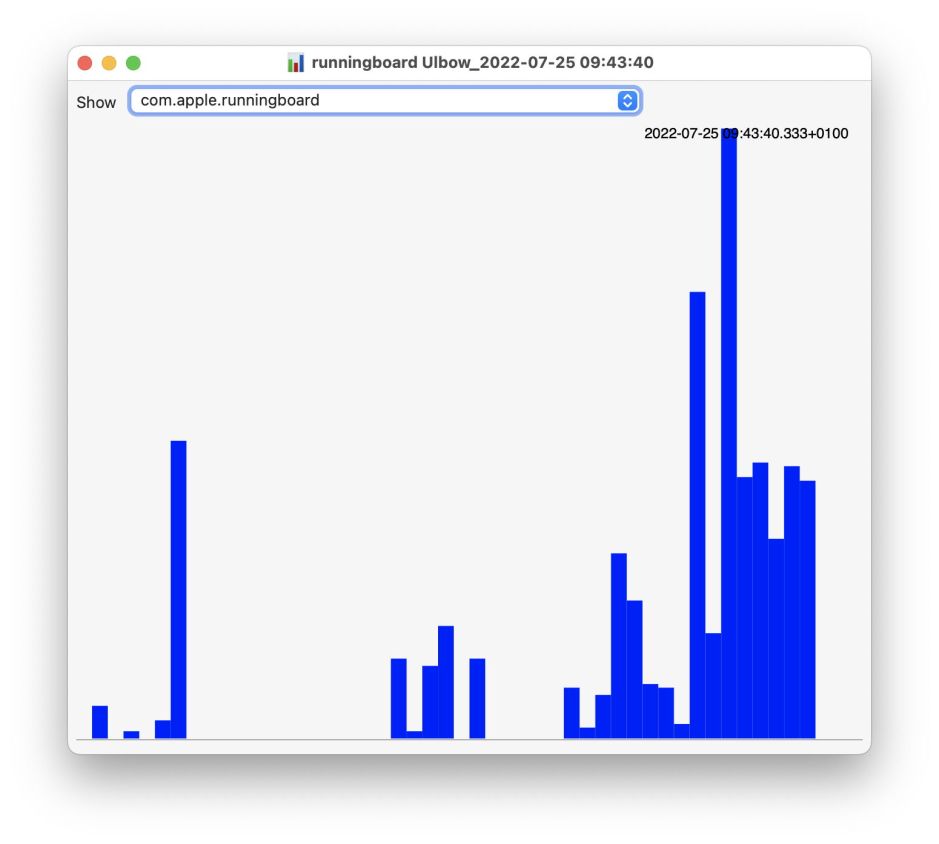
This bar chart shows the frequency of all log entries over the period of the extract, and isn’t affected by any limit on the number of entries shown. Open its popup menu and you’ll see all the subsystems represented in that extract, a useful reference in itself, and can then home in on individual subsystems there. For example, select the com.apple.runningboard entry in the menu, and you’ll see when that subsystem was most active in making log entries. Leave the pointer over one of the bars and a tooltip appears informing you of the timestamp of that peak, and the number of log entries in that period.
I’ll explore Ulbow’s charts more in a future article in this series.
Previous article in this series:
How to find it in the log: 1 An introduction
Software:
