
Ever since macOS Sierra changed to using the Universal log, advanced users have struggled to get useful information from it, or just given up altogether. This series helps you use my free utilities, including Mints and Ulbow, to find information that is both valuable and otherwise completely inaccessible.
Sadly, Apple’s bundled utility for accessing the Universal log, Console, has steadfastly refused to make this process any easier. While you can use it, for example, to follow log entries in real time, or open the log extracts saved in a sysdiagnose, it simply doesn’t do what Console used to. This is a great shame, as the Universal log is actually far more powerful than the old one, but to get the best from it, you need powerful tools.
Browsing the log from a recent boot
The first challenge here is how to discover when your Mac booted. Open Mints, and click on the Boot button in its Log Windows section.
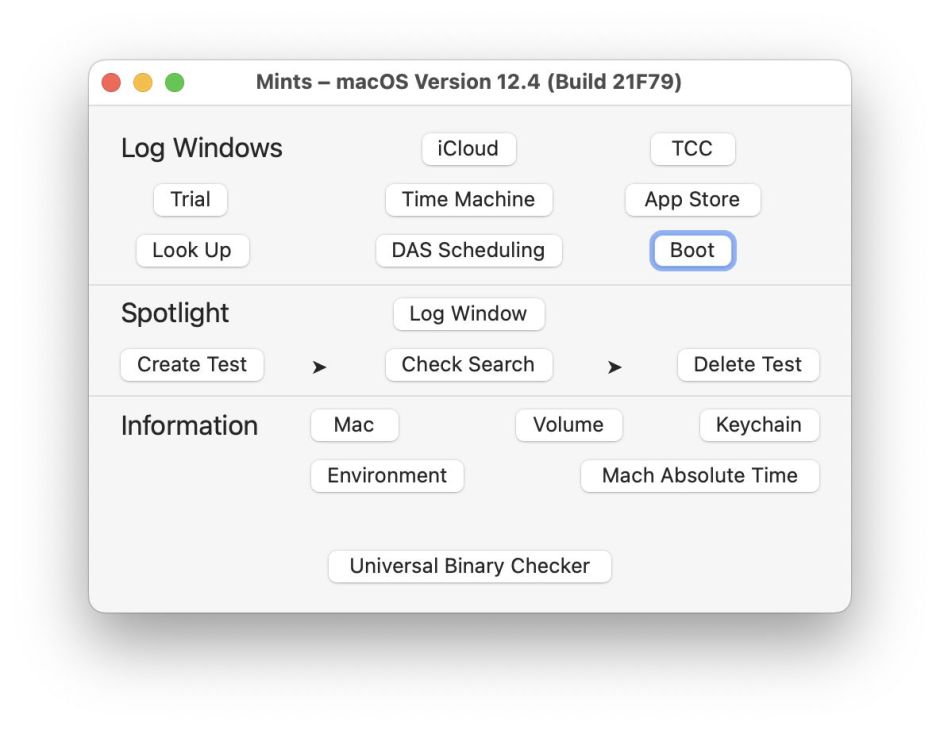
A new window will open, and Mints will then search the log for the last 24 hours and report the exact time of each boot entry, marked with the distinctive string
=== system boot
As that also appears in the log entry recording Mints’ request for those log entries, the last entry reported will be the time that Mints asked for that log extract. Because Mints is searching the whole of the last 24 hours, this will take a few minutes before it reports:
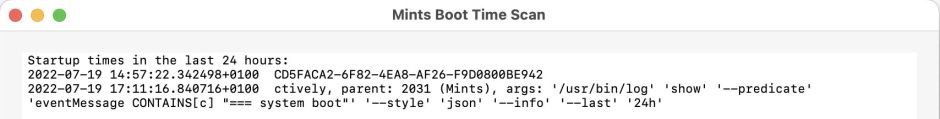
With that window still open, open Ulbow. Open its View menu and check that Limit entries shown is ticked there. This ensures that, even if your request for a log extract returns hundreds of thousands of entries, a maximum of around a thousand will be shown. You can change that number in Ulbow’s Preferences if you wish.
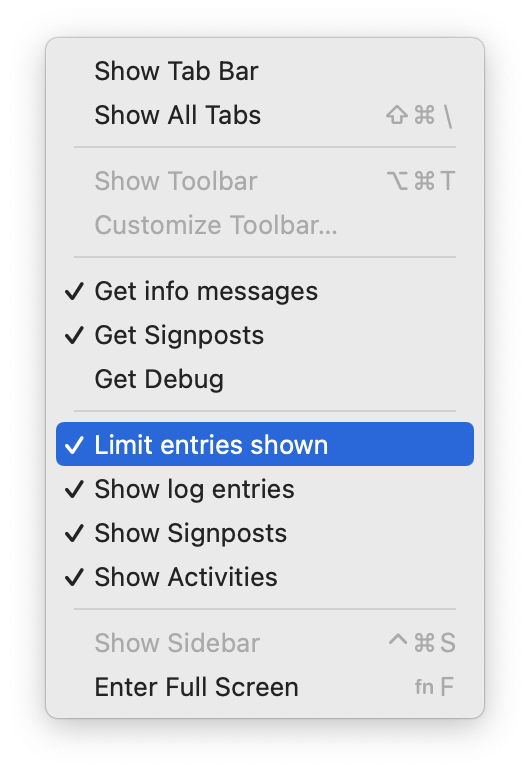
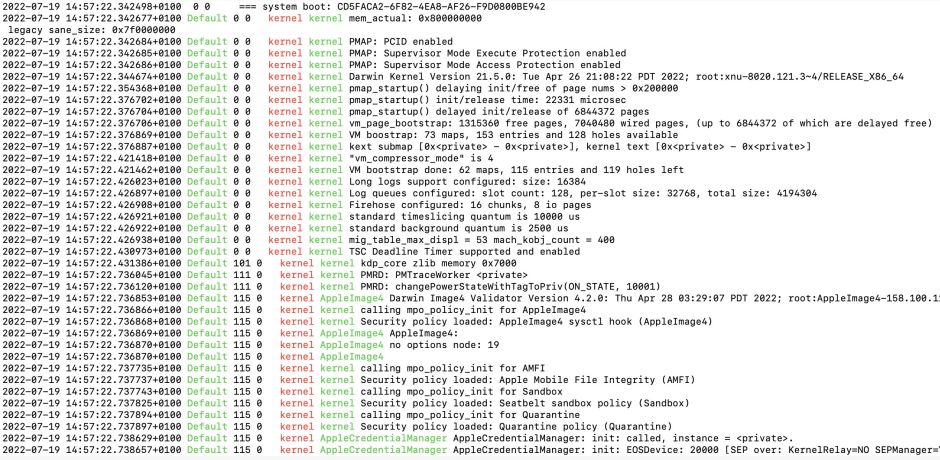
In the controls at the top of Ulbow’s document window, set the Period to 3-5 seconds, and enter the date and time from Mints’ report of the boot you want to browse. Once you’re happy with the settings, as shown, click on the Get log button.
You should then see a fully detailed account of each entry from that boot, starting with the Boot UUID, and reporting the kernel version, and every step in the boot process after kernel loading.
Browsing Time Machine entries
My free utility The Time Machine Mechanic (T2M2) provides some simple extracts from the log to help you check any problems with your backups. Mints takes it one step further, with one of its readymade log windows. To use that, click on the Time Machine button in the upper Log Windows section.
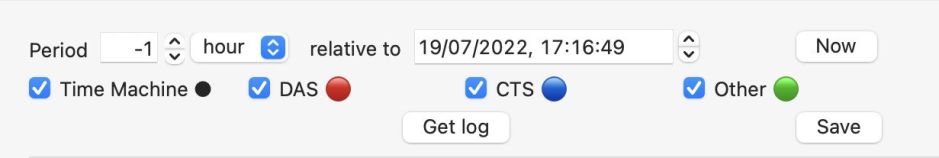
This opens a Mints log browser window with controls similar to those in Ulbow, but simpler. Set this to fetch log entries over the last hour, by setting the Period to -1 hour, relative to the current time (easily set with the Now button, if you need). Then click the Get log button.
After a brief delay, Mints then displays a log extract in which each entry is coloured according to the subsystem responsible.
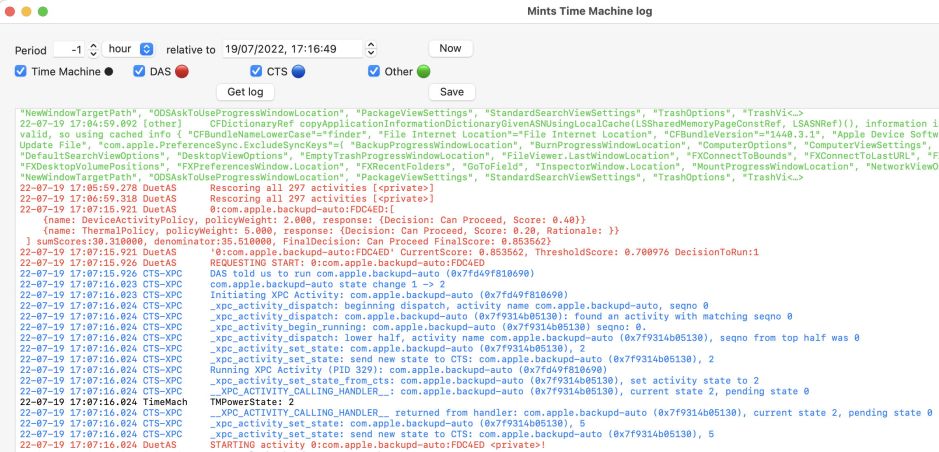
This section of log contains entries from each of the four subsystems included. They’re listed in time sequence so you can trace interactions between different subsystems, such as how DAS dispatches to CTS and initiates each backup. There’s a great deal of detail, and you can focus in on what Time Machine was up to by hiding the other three subsystems, unticking their boxes.
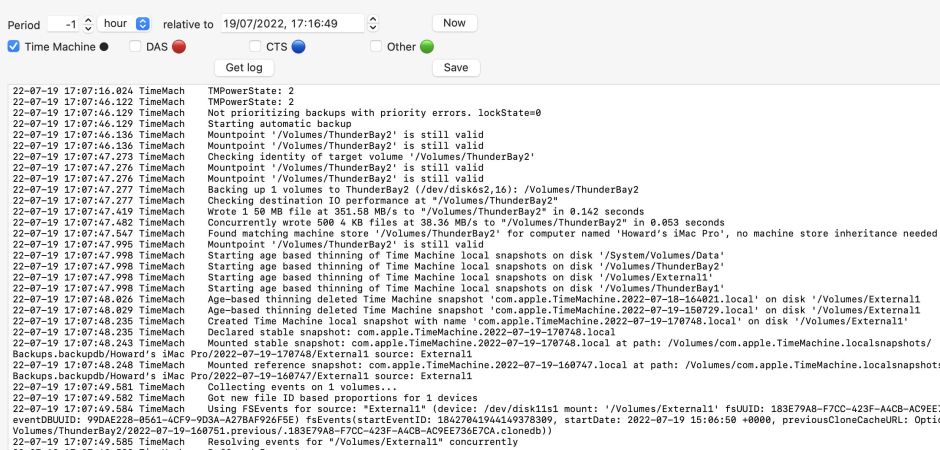
What you then see are only the entries made by Time Machine, making it easier to identify a problem, then add more detail by ticking the other boxes again.
Checking an error in another subsystem
Although Mints has readymade log windows for several types of common problem, it can’t cover everything. Let’s say that you suspect there’s been a glitch in the new macOS service Running Board. Search for relevant articles here using the magnifying glass tool at the upper right of each page in this blog. In this case, it takes you to several articles identifying the subsystem as com.apple.runningboard, which you can apply as a search predicate in Ulbow.
The quick way to do this is to type
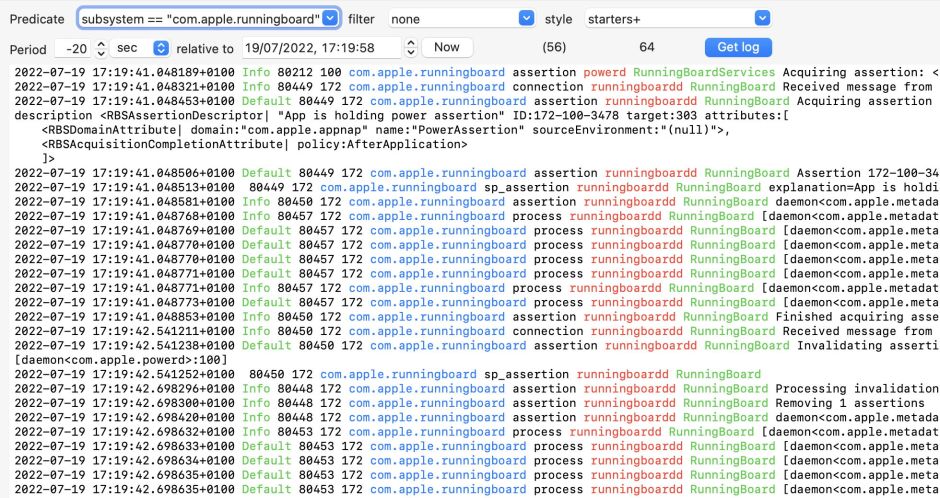
subsystem == "com.apple.runningboard"
into the Predicate combo box, set the Period to something reasonable, and the date and time. As Running Board writes a lot of entries to the log, I’ve set this to cover the last 20 seconds before the time set. When you’re ready and have checked the controls, click on the Get log button.

After a few seconds, you should then see all the log entries for that subsystem in the set period. Ulbow uses colours to distinguish the different fields in each log entry, for instance in this style setting the datestamp in black, the type of entry in green, the subsystem in blue, and so on.
Both Mints and Ulbow have extensive Help books available in their Help menu. These explain each of their tools and commands; for Ulbow it details how you can change its Preferences to add custom predicates, filters and styles to extract and display exactly what you want. I’ll look at those in detail in further articles here. You can also find links to earlier tutorial articles in their product page.
Some users find that trying to get log extracts using Mints, Ulbow, T2M2 and other utilities fails, and returns errors. If that happens to you, first use Ulbow to check that your log is working correctly. In its app menu, the Check Log command opens a new window with a single button, Check Active Log. Click on that to run its tests, and refer to the Check log page in the Help book to interpret the results. Then try working through this article: When T2M2, Ulbow, Cirrus, or another log-based app returns an error.
Mints and Ulbow appear to be fully compatible with Ventura.
