
So far, I have concentrated on trying to understand how macOS allocates threads to the two different types of core in M1 series processors, and how running threads on the E cores can lead to increased energy efficiency. This article looks at how P core frequencies are controlled by macOS, and the dynamics of frequency change.
Background
There are two types of CPU core in M1 series chips:
- E cores contain roughly half the internal processing units of P cores, and have a maximum frequency of 2064 MHz.
- P cores have a higher maximum frequency, of either 3204 MHz in the original M1, or 3228 MHz in M1 Pro/Max/Ultra.
In this article, observations are limited to the cores in an M1 Max chip in a Mac Studio Max, which are essentially the same as those in the M1 Pro. These chips have 2 E cores and 8 P cores, arranged in three clusters: one cluster of two E cores, and two clusters P0 and P1 each containing four P cores. All cores within any given cluster are run at the same frequency, and generally (but not always) have their load balanced within that cluster.
macOS normally manages threads through Grand Central Dispatch using Quality of Service (QoS) settings. Those with the lowest QoS of 9 will only be run on the E cluster, while those with higher QoS can be assigned to either E or P clusters. macOS adopts a strategy where most, if not all, of its background tasks are run at lowest QoS. Most user tasks, including the GUI, are run on the P cores, unless they’re already fully loaded and the E cores available to take additional load.
A more detailed summary of previous work is in this article and many others here which precede it.
E cores are normally managed by macOS to run at frequencies of 600 MHz (idle), 972 MHz (one or few threads) or 2064 MHz (multiple threads). In observations of normal use, P cores are also seen to be operating at various intermediate frequencies between 600 and 3204/3228 MHz. These tests were designed to discover how macOS apparently manages P core frequencies more flexibly.
Methods
The only user-accessible tool which can provide measurements of power, frequency and active residency for cores and clusters is powermetrics. In these tests, powermetrics collected 100 cpu_power measurements for 50 ms periods while tasks lasting less than 5 seconds and consisting of fixed numbers of threads were performed using AsmAttic and Cormorant at various QoS settings.
Key among those were:
- Floating-point synthetic load in AsmAttic of 1-4 threads run at high QoS on cluster P0 alone
- Floating-point synthetic load in AsmAttic of 50 short threads run at high QoS across all clusters
- Apple Archive compression tasks in Cormorant of 4 threads at high QoS
- Floating-point synthetic load in AsmAttic of 2 threads run at low QoS on the E cluster alone.
Reported cluster power, HW active residency by frequency, and individual core total active residency were then analysed.
Results
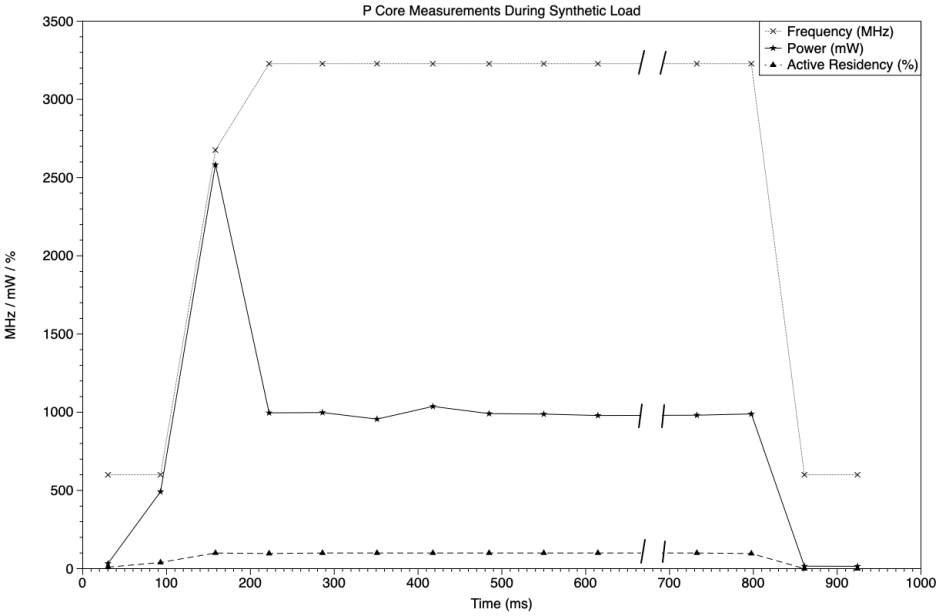
This graph shows an atypical result from a single-threaded synthetic task confined to the P0 cluster. Each point shown represents the value from one 50 ms sampling period, with only dominant frequencies shown. As active residency rose to 100% on the active core, frequency and power both rose. In this case, uniquely among these results, power spiked at over 2.5 W in the first period at 100% active residency; normally, power rose to its sustained level without that initial spike. Sustained high frequency was slower to attain than either high power or maximum active residency.
Once the thread(s) had completed, active residency, power and frequency all fell rapidly back to idle levels.
Detailed analysis of the powermetrics data showed a range of cluster frequencies in each sampling period prior to the sustained frequency being established. Although powermetrics doesn’t give frequency measurements by time within each sampling period, it does give the percentage active residency for each frequency measured during the sampling period. During the initial period of increasing frequency that represents the proportion of time in that sampling period during which the cluster was running at that frequency. It’s thus possible to estimate the duration of the on-ramp during which frequency is increasing, and the period within that spent at each frequency.
All tests on P cores showed an on-ramp lasting about 70 ms, the time taken for the cluster frequency to increase from 600 MHz at idle to exceed 3 GHz peak. Three different frequencies were seen for that peak: 3036 MHz, which was most common with more threads, 3132 MHz, seen with two threads, and the maximum frequency of 3228 MHz, which was usual with just one thread.

This graph shows cluster frequency at different times during the on-ramp, estimated from figures for active residency by frequency across three consecutive collection periods. The line fitted has the quadratic equation
frequency = (-1147.1) + (58.768 * x) + ((-0.19638) * x^2)
where x is time in ms and the frequency is in MHz. Total on-ramp time is the time for cluster frequency to rise above 600 MHz until it exceeds 3 GHz.
To confirm this, tests were run in which the duration of each task was about 30 ms, less than half the observed duration of the on-ramp. In those, active residency fell with thread completion before frequency could reach 3 GHz, demonstrating rapid response of control in returning frequency to 600 MHz once those shorter threads completed.
With the synthetic load, sustained power was 1000 mW for a single thread/core, increasing by 900 mW for each additional thread/core, to a maximum of 3700 mW. Those are about half the power required for Apple Archive compression, which reached a maximum of 7300 mW when run in four threads on the P0 cluster.
No significant off-ramp was seen on P cores. Within 5 ms of threads completing, cluster frequency fell to 600 MHz idle.
Repeating some of these tests on the E cores at a QoS of 9 showed no comparable on-ramp, although it wasn’t uncommon to see E cluster frequency rise first to 972 MHz before increasing to the maximum frequency of 2064 MHz within 15 ms. No significant off-ramp was observed in E cores, with their frequency falling to 972 or 600 MHz within 10 ms of threads completing.
Conclusions
- macOS runs P cores at two steady-state frequencies: idle at 600 MHz, and full speed, which can range between 3036, 3132 and 3228 MHz (3204 MHz on the original M1).
- P cores typically take about 70 ms for their frequency to rise from idle to full speed.
- Once threads complete on all P cores in a cluster, its frequency returns to 600 MHz idle almost immediately.
- P cores run at intermediate frequencies with combinations of threads, and when threads complete during the on-ramp, before full speed is reached.
- macOS runs E cores at three steady-state frequencies: idle at 600 MHz, economy at 972 MHz, and full speed at 2064 MHz. They don’t show significant on- or off-ramps, and intermediate frequencies appear uncommon.
- P core frequency management is designed to deliver full power to complete threads quickly.
- E core frequency management is designed to complete threads with efficiency of power used.
