
As more developers are looking at giving the user control over which cores do the heavy lifting in their apps, when running on M1 Macs, they’re puzzling over contradictory figures given by Activity Monitor. In many cases, these appear to demonstrate that running code exclusively on E cores uses more energy, not less. This article explains why, and its message is not to trust Activity Monitor over CPU or Energy figures.
To understand what they’re seeing, I used my app AsmAttic to run tests with different numbers of threads at the two extremes of QoS: 9 or ‘background’, which constrains the code to E cores, and the highest of 33, which runs the code preferentially on the P cores until they’re fully loaded, then uses available E cores as well.
Are E cores really less efficient?
For this introductory example, I use 8 threads of floating point maths on an M1 Max (in a Mac Studio), and a tight loop run 1 billion times in each thread. The results from the two different QoS settings are:
- 8 threads on 8 P cores took 6.6 s.
- 8 threads on 2 E cores took 40.4 s.
So there’s a big performance hit from constraining that code to the E cores. What do you get in return? According to Activity Monitor’s Energy pane:
- On 8 P cores, an energy value of 800 was sustained for 6.6 s, giving a total of 5280 units.s, or 660 per thread.
- On 8 E cores, an energy value of 194 was sustained for 40.4 s, giving a total of 7838 units.s, or 980 per thread.
The clear conclusion is that running these eight threads on the E cores was considerably less efficient than running them on the P cores. And if you believe that, you drop the idea of offering the user control over QoS, and run all that app’s code at high QoS after all.
Activity Monitor’s problems
This result occurs because Activity Monitor, currently version 10.14 in macOS 12.3.1, doesn’t know the difference between processors with identical cores running at fixed frequency, and Apple’s M1 chips, with two different types of core and variable frequencies for each cluster of cores. Given that it’s now nearly 18 months since Apple started shipping its first M1 Macs, you might think that a little surprising. It’s even worse that Activity Monitor’s errors are discouraging developers from making better use of the cores in M1 chips.
If you’ve got an M1 Pro or Max available, it’s not hard to see where this is going wrong.
With an app like AsmAttic, run a single thread at minimum QoS so it runs only on the E cores. Then repeat that with two threads imposing the same computational load. Here are my results:
- 1 thread on 2 E cores took 19.5 s, at 98% CPU and an energy value of 99.
- 2 threads on 2 E cores took 10.0 s, at 194% CPU and an energy value of 194.
The single thread has a total energy of 1931 units.s, at 1931 per thread. Running two threads has a total energy of 1940, at 970 per thread. So running twice the amount of code on E cores alone takes the same amount of energy, according to Activity Monitor. That’s obviously wrong.
To discover how Activity Monitor is coming to those false results, you’ll need to run the command tool powermetrics to discover the frequencies the two E cores were running at, and their actual power consumption. Although this is fiddly, the effort is worth it: with the single thread, the E cores run at a frequency of about 972 MHz, but with two threads that increases to their maximum of 2064 MHz. Activity Monitor is oblivious of that, and doesn’t correct its CPU values to allow for frequency changes.
A little study of the figures given for energy show they’re essentially the same as CPU, and that, regardless of frequency or core type, full active residency of a core counts as 100% CPU and 100 energy units, just as they would on an Intel processor with its identical cores. Thankfully powermetrics quickly disabuses of that gross error: 100% active residency of an E core running at maximum frequency uses around 100 mW, and the same active residency of a P core running at its higher maximum frequency uses ten times that amount, 1000 mW.
Results differ on different M1 models
Because macOS controls the frequency of E cores on different M1 chips differently, your results won’t be consistent across different Mac models. Those given here were obtained on an M1 Max, and the M1 Pro is essentially identical. Use an original M1, though, and Activity Monitor considers that its four E cores and four P cores are just the same. Run the same four threads at minimum QoS on its E cores, which remain at a frequency of about 972 MHz, and they’ll compare even more unfavourably with those threads at higher QoS on its P cores, running at 3204 MHz.
Can you use Activity Monitor for rough comparisons?
Until Apple updates the figures returned by Activity Monitor for M1 chips, confounding by core type and frequency makes it not just useless, but actually misleading for comparing CPU % or energy. If you need to assess those, for example when considering whether to let the user change the QoS of threads in your code, the only reliable tool is powermetrics, which provides details of cluster frequencies and power use, as well as active residency.
Even Activity Monitor’s CPU History window requires careful interpretation to avoid propagating error. The image below shows the window for four of those tests on an M1 Max, from the left:
- 1 thread on 2 E cores, 19.5 s.
- 2 threads on 2 E cores, 10.0 s.
- 8 threads on 8 P cores, 6.6 s.
- 10 threads on 2E+8P cores, 7.1 s.
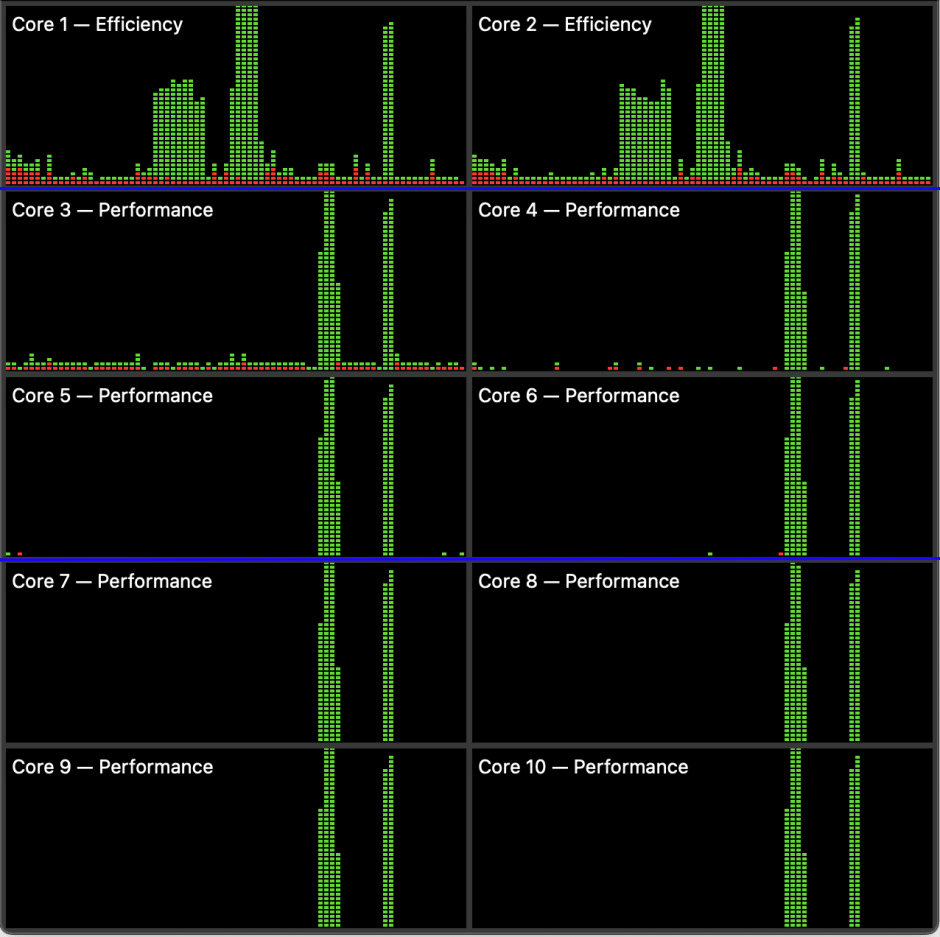
Blue lines divide cores into their clusters.
To further illustrate the errors generated by Activity Monitor, here are its measurements of total energy used per thread in my series of tests:
- 1 thread on 2 E cores, 1931 units.s/thread.
- 2 threads on 2 E cores, 970.
- 8 threads on 2 E cores, 980.
- 8 threads on 8 P cores, 660.
- 10 threads on 2E+8P cores, 704.
Those appear to demonstrate that any use of the E cores, even in combination with all the P cores, results in higher energy use. Taken at face value, it makes you wonder why Apple bothered putting any E cores into its M1 series chips.
Until Apple updates Activity Monitor to give reasonable figures for M1 chips, don’t use or trust its CPU % or energy values: they’re nonsense.
Postscript
If you’d like to see what happens with real-world apps, and their performance on E and P cores, this sequel article shows how you can assess energy and power using powermetrics, and demonstrates that using the E cores can use less than 30% of the energy of the P cores in real life.
