

The leading factors determining your Mac’s performance are loading of its processor cores, memory use, accessing storage, and network speed; for graphics-intensive apps you can add the performance of its GPU. Each of those has its own view and information in Activity Monitor, which helps you work out where and what performance problems are. In this article I look at one aspect which became a major concern for many in Monterey 12.0.1: memory.
Before reading any further, you might like to open Activity Monitor to follow what I’m showing. If you’re running Monterey 12.0.1 or 12.1, you can even test this yourself, as I’ll describe.
In Activity Monitor, click on the Memory tab at the top of the window, then click the column header Memory to sort the entries with the largest memory use at the top. In the View menu, ensure that All Processes is ticked, or system processes may be hidden. Confirm that the window title reads Activity Monitor All Processes.

With my normal working apps open, the largest user of memory is Postbox, but none takes more than 600 MB. Looking at the detail at the foot of the window, you’ll see a value for the physical memory installed in your Mac, how much memory is used, whether there are any files which are cached to disk storage, and any swap memory usage.
Memory used is further broken down into App and Wired memory, and the amount that’s compressed to save space.
macOS tries to make best use of the physical memory installed, and use a minimum of swap, as the latter is slower to access as it has to be read back from disk into memory first. In this case, there’s ample free physical memory, and the chart at the bottom left shows no memory pressure at all. That all looks generally healthy.
macOS supports the extension of memory to include disk storage, so-called virtual memory. This is managed by a combination of hardware and software, which enables some of the memory being used to be swapped out to disk, rather than occupying physical memory. There are complex trade-offs in putting what should be in physical memory into disk storage, and how much physical memory to keep free. These are normally managed expertly by macOS, and shouldn’t be meddled with.

Note that memory use is quite different from loading the processor cores. If you click on the CPU tab at the top and order the list of processes by % CPU, you’ll see that WindowServer is near the top of both, as it’s responsible for compositing all the windows into the image used for the display. Other than that, many processes using significant amounts of CPU are different from those using most memory.
Switch back to the Memory tab, then open a Finder window and set it to Find files at the foot of the File menu. Type two or three letters into its search box, and watch what happens to the Finder’s use of memory.

The memory used by the Finder quickly starts to climb, here reaching over 1 GB, and continues to rise as long as the Finder continues to search for files.
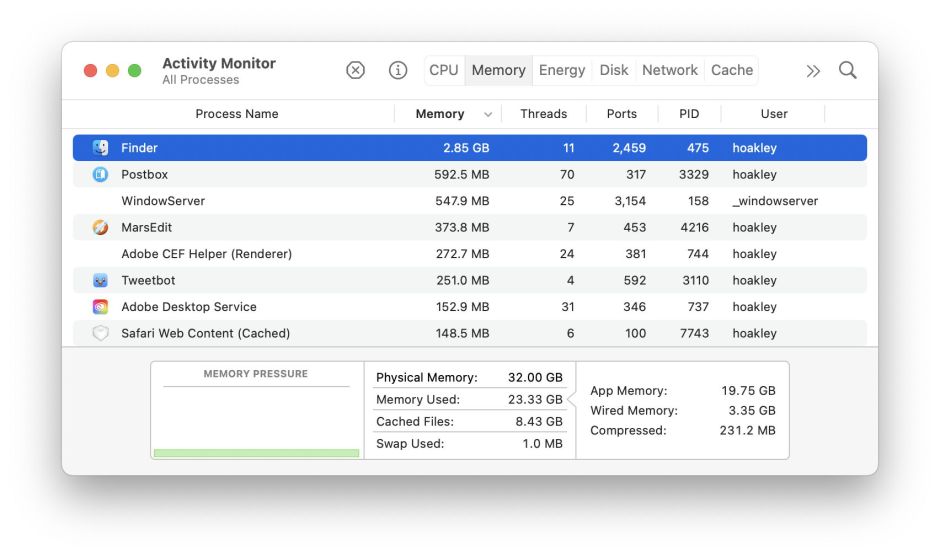
As it sails past 2.85 GB, note how the figure for total Memory Used also rises, as does App Memory. Memory pressure remains in the green, though, as we started with so much free.

In this particular search, memory used by the Finder reached a maximum of 3.11 GB. Not only that, but closing the Find window didn’t recover any of that used memory: from now on, that’s the Finder’s starting point. Perform another Find and the memory used by the Finder will soar again, and never fall. It will do that, voraciously consuming memory, until the Finder is restarted.
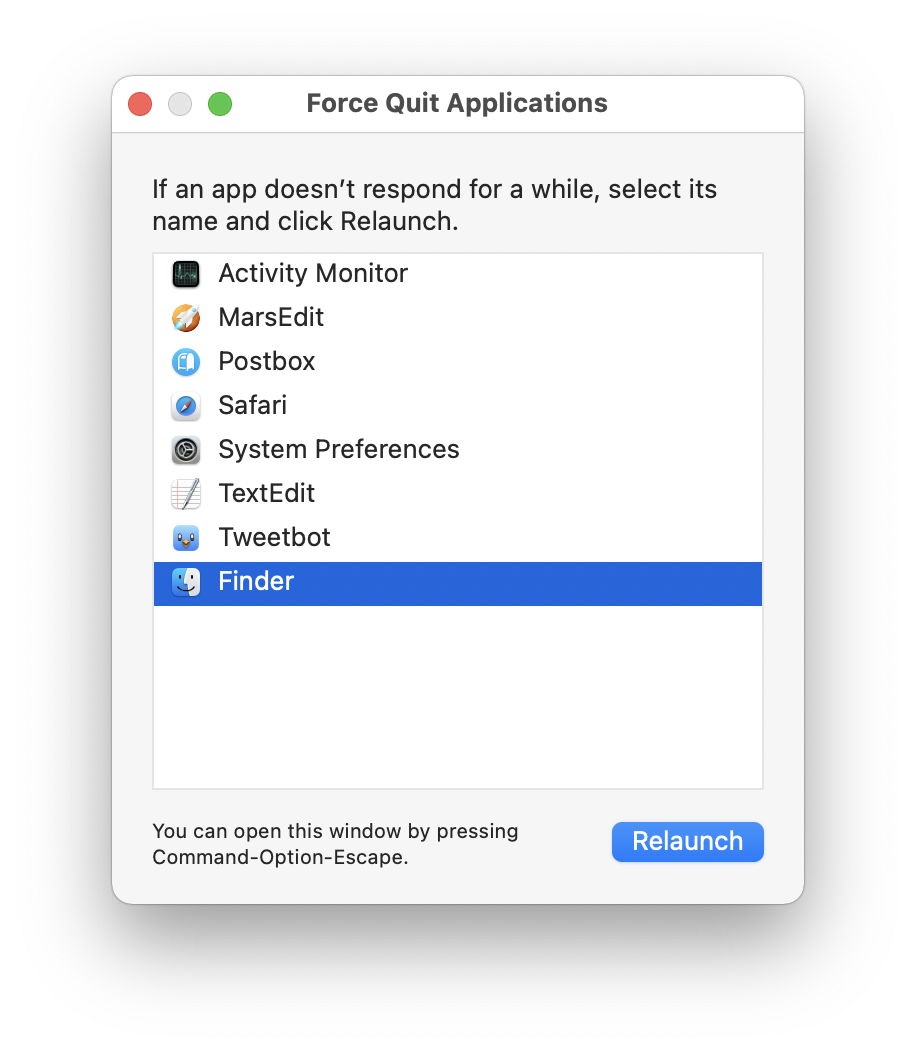
Open the Force Quit dialog by pressing Command-Option-Escape, select the Finder there, and click the button to Relaunch it.

Once the Finder has restarted, you’ll see how little memory it should have been using. Although it can’t run for long in a mere 93 MB, both the Finder and your Mac will be able to run much faster again, with ample free memory.
This is a simple example. In other problems, the numbers may not be as clear-cut. What often happens is that memory use rises when performing certain operations, then falls when those are complete, but never returns to its original value, and slowly climbs during use. That’s a slow memory leak, rather than the rapid gusher in the Finder’s Find command as at present.
Hopefully this has given you more confidence in identifying leaks and other memory problems which can bring your Mac to its knees.
