
The bug in macOS Catalina 10.15.6 which can result in kernel panics isn’t simple to grok. In this article, I try to explain how the kernel manages memory for itself and its extensions in Mach zones, and how a memory leak within those can cause a panic.
macOS consists of two major divisions: the kernel and its extensions which run in kernel mode, and user processes which are run in user mode even if they’re running as root user. This is reflected in one of the central tasks performed by the kernel, managing memory. When a user process wants some memory, it asks to be allocated some by the kernel using a call such as malloc(); when a kernel extension wants some memory allocated to it, it uses a different call such as zalloc() or kalloc(), which isn’t available to user processes, so that the memory is allocated from that reserved for kernel mode processes.
The kernel and its more than 300 extensions are kept extremely busy handling all the essential tasks that user processes expect. Doing so requires that they can be allocated and deallocated memory very quickly. macOS provides a special mechanism for doing this: Mach zones, which are similar to what are known as memory caches in Linux, or Pools in Windows.
During kernel boot, many standard Mach zones are created and set up ready for the kernel and its extensions to use, and others can be created later when required. Typically, in Catalina there will be more than 300 Mach zones once the system is up and running. Each has a name, and can be inspected using the command
sudo zprint
which lists the zone name, the size of the memory blocks it contains, its current total size and the maximum, the current number of elements and the maximum, and more.
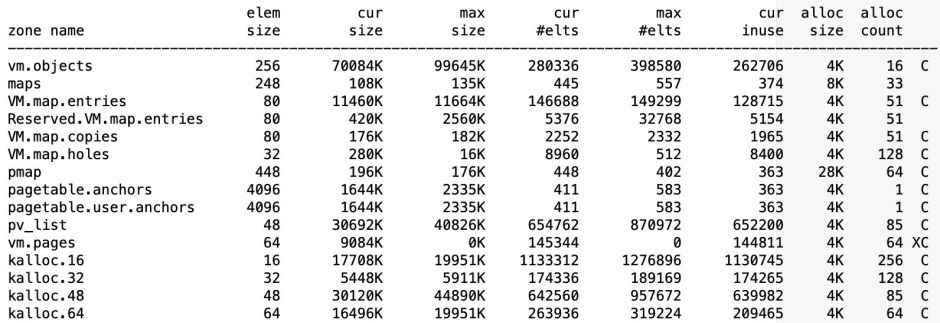
Among the more important and prominent Mach zones are:
- buf.512 to buf.16384, which are buffers for the VFS file system;
- HFS.node and others, which are used for the HFS+ file system;
- APFS_BTREE_NODES and others, which are used by the APFS file system;
- ipc.ports and others, which support InterProcess Communication;
- kalloc.16 to kalloc.16384, which are kernel allocations made by
kalloc()calls; - maps and other map zones, used by kernel VM mapping;
- mcache and others, which support BSD’s Mcaches.
Once the Mach zones have been set up, the kernel and its extensions may use calls such as zalloc() and kalloc() which provide fast access to memory. When kalloc() is used, that memory will be allocated from one of the kalloc.n zones. These exist – in 64-bit macOS at least – in sizes which are powers of 2, such as kalloc.16 (the smallest), kalloc.256, up to kalloc.16384 (largest). There are also a few, such as kalloc.48 and kalloc.80, which are additional to that power-of-two rule.
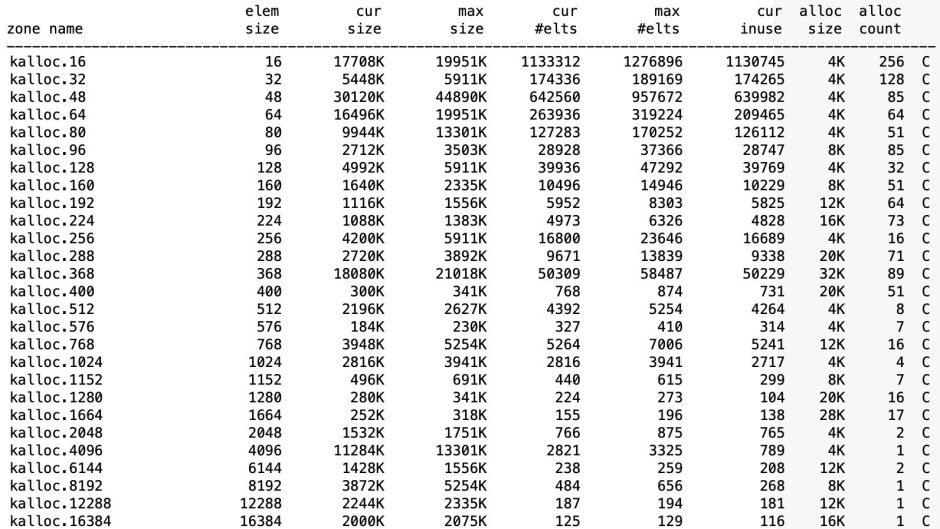
These kalloc.n zones provide memory quickly by making it an off-the-shelf commodity. When an app needs 4000 bytes, instead of having to locate a suitable block of memory as a custom job, a block from the kalloc.n zone for the next largest size is returned, in that case from kalloc.4096, which is far quicker. It’s less efficient, though, as a request for 4097 bytes has to be met by 6144 bytes from the kalloc.6144 zone – hence the careful choice of element sizes.
Like many memory management systems, Mach zones have a garbage collection service, which runs periodically, and when there’s a shortage of free elements within a zone.
What should happen when a kernel extension needs memory allocated to it is that it calls kalloc() or one of its relatives, and receives the memory allocated from within the appropriate kalloc.n zone. When it has finished using that memory, it releases it and the garbage collector returns it to the kernel as free.
What happens with a memory leak is that the memory is allocated, but never returned to the kernel. Over time, even a small leak can progressively consume all the elements currently allocated within one or more zones. This is detected as the zone size in use approaches its maximum, the high water mark. Some zones are expandable, and macOS can then allocate additional memory from a dedicated zone_map area to expand that zone. Rarely, such additional memory can be obtained from memory outside the zone_map, but in most cases that’s not possible, and the eventual result is zone_map_exhaustion – zone memory has run out, even though some kalloc.n zones still have memory available. Thus, a memory leak in a kernel extension can run the kernel out of zone memory, something you may well not notice in Activity Monitor, which is more concerned with the management of user memory.
In the case of my kernel panic, this was visible in the log long before the panic.
Around 25 minutes before the panic occurred, the kernel was complaining that its zone_map was becoming exhausted:
03:21:09.447981+0100 kernel zone_map_exhaustion: Zone map size 12240662528, capacity 12884901888 [jetsam limit 95%]

03:21:09.448533+0100 kernel zone_map_exhaustion: Largest zone kalloc.48, size 6544393440

03:21:09.449437+0100 kernel kernel zone_map_exhaustion: Nothing to do for the largest zone [kalloc.48]. Waking up memorystatus thread.
It was unable to expand the largest of the zones, kalloc.48, and couldn’t free up any more memory by garbage collecting.
The kernel therefore started killing processes in an effort to claw back its zone_map to safety:
03:21:09.480924+0100 kernel 1238233.930 memorystatus: killing_highwater_process pid 415 [lsd] (highwater 3) 107552KB - memorystatus_available_pages: 4176741

03:21:09.481007+0100 com.apple.MemoryMonitor plugin UserEventAgent MemoryMonitor kernel jetsam snapshot note received

03:21:09.481234+0100 osanalyticshelper extending prolongation transaction timer

03:21:09.481275+0100 osanalyticshelper Attempting to write jetsam report

03:21:09.481552+0100 OSAnalytics Process lsd [415] killed by jetsam reason highwater

03:21:09.481606+0100 OSAnalytics Tagging submission policy as alternate for logtype:298
Jetsam is the process which has been brought from iOS to macOS to manage memory more aggressively, to try to avoid shortage from affecting more important processes.
The memory leak continued for another 24 minutes or so before the kernel was unable to free up any more memory by killing processes, and the zone_map was well and truly exhausted. The only remaining option was then to call a panic, forcing the system to be shut down altogether.
The panic log explained:
panic(cpu 8 caller 0xffffff80017729eb): "zalloc: zone map exhausted while allocating from zone kalloc.12288, likely due to memory leak in zone kalloc.48 (6586956000 total bytes, 137228148 elements allocated)"@/AppleInternal/BuildRoot/Library/Caches/com.apple.xbs/Sources/xnu/xnu-6153.141.1/osfmk/kern/zalloc.c:3627
The event which finally led to the panic wasn’t trying to allocate memory from the kalloc.48 zone, but from kalloc.12288. However, at the time the kalloc.48 zone had grown very large, making it the most likely candidate cause, in that the memory leak was most significant in 48 byte allocations from the kalloc.48 zone.
As a user, there often isn’t much you can do to help the kernel, other than by voluntarily restarting once the leak was getting out of hand. You can inspect the kalloc.n zones with the command
sudo zprint kalloc
which should make it clear which are growing to a dangerous size. zprint also supports options which allow you to monitor changing allocations, which could help.
Although using it is non-trivial, Apple provides special debug builds of the kernel which provide engineers with more tools to investigate memory leaks and Mach zones.
References
Jonathan Levin’s *OS Internals, bonus chapter 12
and his books, including Mac OS X and iOS Internals, to the Apple’s Core.
