
Normally when an app ‘crashes’ it quits unexpectedly, leaving you with its parting crash report in a dialog. This is invaluable help for working out what went wrong, mainly because it gives you a precise time for the event, which you can use to see what happened in the log. Usually, though, the cause given in that report doesn’t provide much of a clue. If you fancy trying your hand at interpreting the crash log, this old Technical Note explains it, and there’s a whole session from WWDC 2018 devoted to the subject.
Whatever you do, your most important action is to record the datestamp given in the Crash Report for use when browsing the log. If there’s no crash report, look at the system clock quickly and write down your best estimate of the time that the crash occurred.
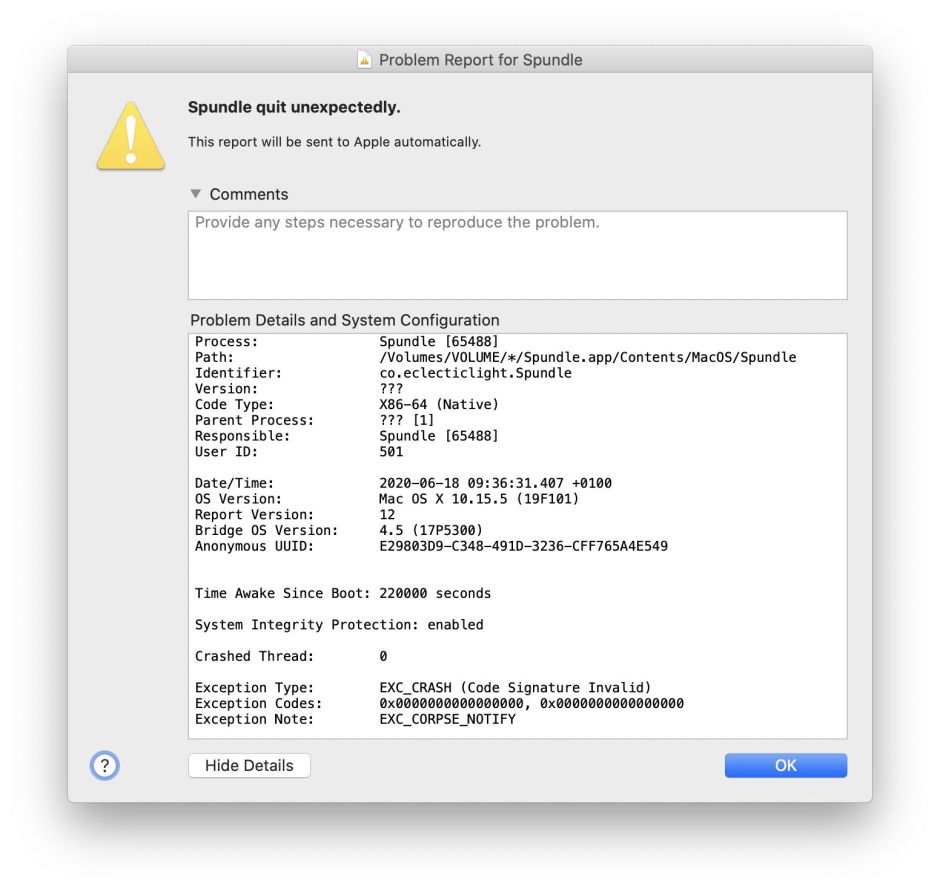
In this case, the crash report gives a clear and understandable cause: the app’s signature is broken, which will cause it to unexpectedly quit immediately after you try to open the app.
Process:               Spundle [65488]

Identifier:            co.eclecticlight.Spundle

Date/Time:             2020-06-18 09:36:31.407 +0100

Exception Type:        EXC_CRASH (Code Signature Invalid)
1. Prepare Ulbow
In most cases, apps crash because we do something. It might be trying to open them, clicking/tapping on a button, or selecting a menu command. When trying to work out what went wrong, we need to examine the log from that action through to the moment that the app died or was killed. Although you can follow user actions like those through ordinary log entries, the most direct way is by seeing what Apple terms Activities. We also want to look at just a few seconds, so should be safe to turn off limits on the number of entries shown.

For these reasons, set the View menu up to Show Activities, with Limit entries shown unticked. In the browser window, switch to a style of regular, which gives a bit more detail than basic+. Then in the Ulbow menu save those settings as defaults.
2. Get the log extract
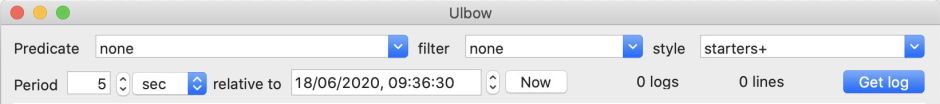
Set the reference time in relative to to around 4 seconds before the time in the crash report and set the Period to 5 sec. Alternatively, you can set the reference time to the next second up from that in the crash report, and the Period to -5 sec. Either of these will capture the period we’re most interested in. Then click on the Get log button.
3. Locate the cause
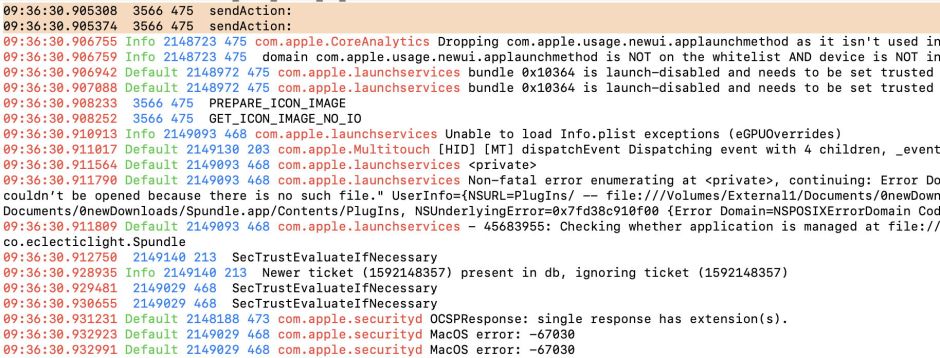
In this case, I double-clicked the app’s icon in a Finder window, which results in a distinctive Activity record consisting of two pairs of log entries like
0.905308  3566 475  sendAction:

0.905374  3566 475  sendAction:
Around them are various references to icons being fetched and displayed. Other clicks, such as those on a menu command or button, have similar activity entries in the log.
These are usually easy to locate visually by scrolling down the log entries shown. If there are too many or you’re unsure, use the Find command to locate them, or type Action: into the filter combo box and press the Tab key.
Note the timestamp of these entries: they mark the start of the log entries in which we’re interested.
Sometimes, just a little scrolling down from here reveals an early error or failure which may tell us what went wrong in the end. Here, I found
0.912750  2149140 213  SecTrustEvaluateIfNecessary

0.928935 Info 2149140 213  Newer ticket (1592148357) present in db, ignoring ticket (1592148357)

0.929481  2149029 468  SecTrustEvaluateIfNecessary

0.930655  2149029 468  SecTrustEvaluateIfNecessary

0.931231 Default 2148188 473 com.apple.securityd OCSPResponse: single response has extension(s).

0.932923 Default 2149029 468 com.apple.securityd MacOS error: -67030

0.932991 Default 2149029 468 com.apple.securityd MacOS error: -67030
This tells me that macOS performed a trust evaluation on the app I was trying to open, which returned an error of -67030. One place to look up such security errors is the Help book of my free app Signet: the page on Interpretation there lists error codes from signature validation, including
-67030 invalid Info.plist (plist or signature have been modified)
But at this stage, macOS hasn’t decided to do anything drastic about it.
4. Locate the outcome
Now scroll through the log entries until you reach the time given in the crash report. This is the end of the sequence that we’re interested in, and should show how and why the app crashed or, in this case, was crashed by macOS. Here, the time was 09:36:31.407, where the following entries are to be found:
1.406010 Default 2149167 0  AMFI: code signature validation failed.

1.411592 Default 2147982 207 com.apple.MobileFileIntegrity <private>: Broken signature with Team ID fatal.

1.415304 Default 2149167 0  proc 65488: load code signature error 4 for file "Spundle"

1.417356 Default 1968301 543  Parsing corpse data for process Spundle [pid 65488]

So that original error -67030 was the start of the problems, which finally reached AMFI (Apple Mobile File Integrity), which decided that my app had to be crashed because of a broken signature.
5. Address the cause
We can’t fix that signature ourselves. The only corrective action is to trash that copy of the app and try a fresh copy.
This has been a fairly straightforward problem, with clear error messages and an obvious solution. Although not rare, life is usually more complicated, and we’re left trying to find needles in logstacks. In the next tutorial in this series, that’s exactly what I’ll be looking at, and introducing the power of predicates to limit the log entries which you have to look through.
