

Logistician demonstrates how useful the statistical summaries of log files can be, but hadn’t yet made those accessible to further analysis. Version 1.3 now rectifies that, as it can export the contents of its summary table in CSV format, ready to open in Numbers, Microsoft Excel, DataGraph, and any other app with support for importing that format.
After spending some time in Numbers, I realised how tricky date and time formats and formulae can be, so the CSV output contains fields that should simplify their use:
- enddate – the date and time when that log file was closed, in
dd/mm/yyyy hh:mm:ssformat - middate – the date and time of the middle of the period that log file was open, in the same format
- duration – the time in seconds the log file was open for writing new entries
- size – the size in KiB of the uncompressed data in that log file
- rate – the average rate in bytes/second of uncompressed log data written to that log file
- file – the type and name of that log file.
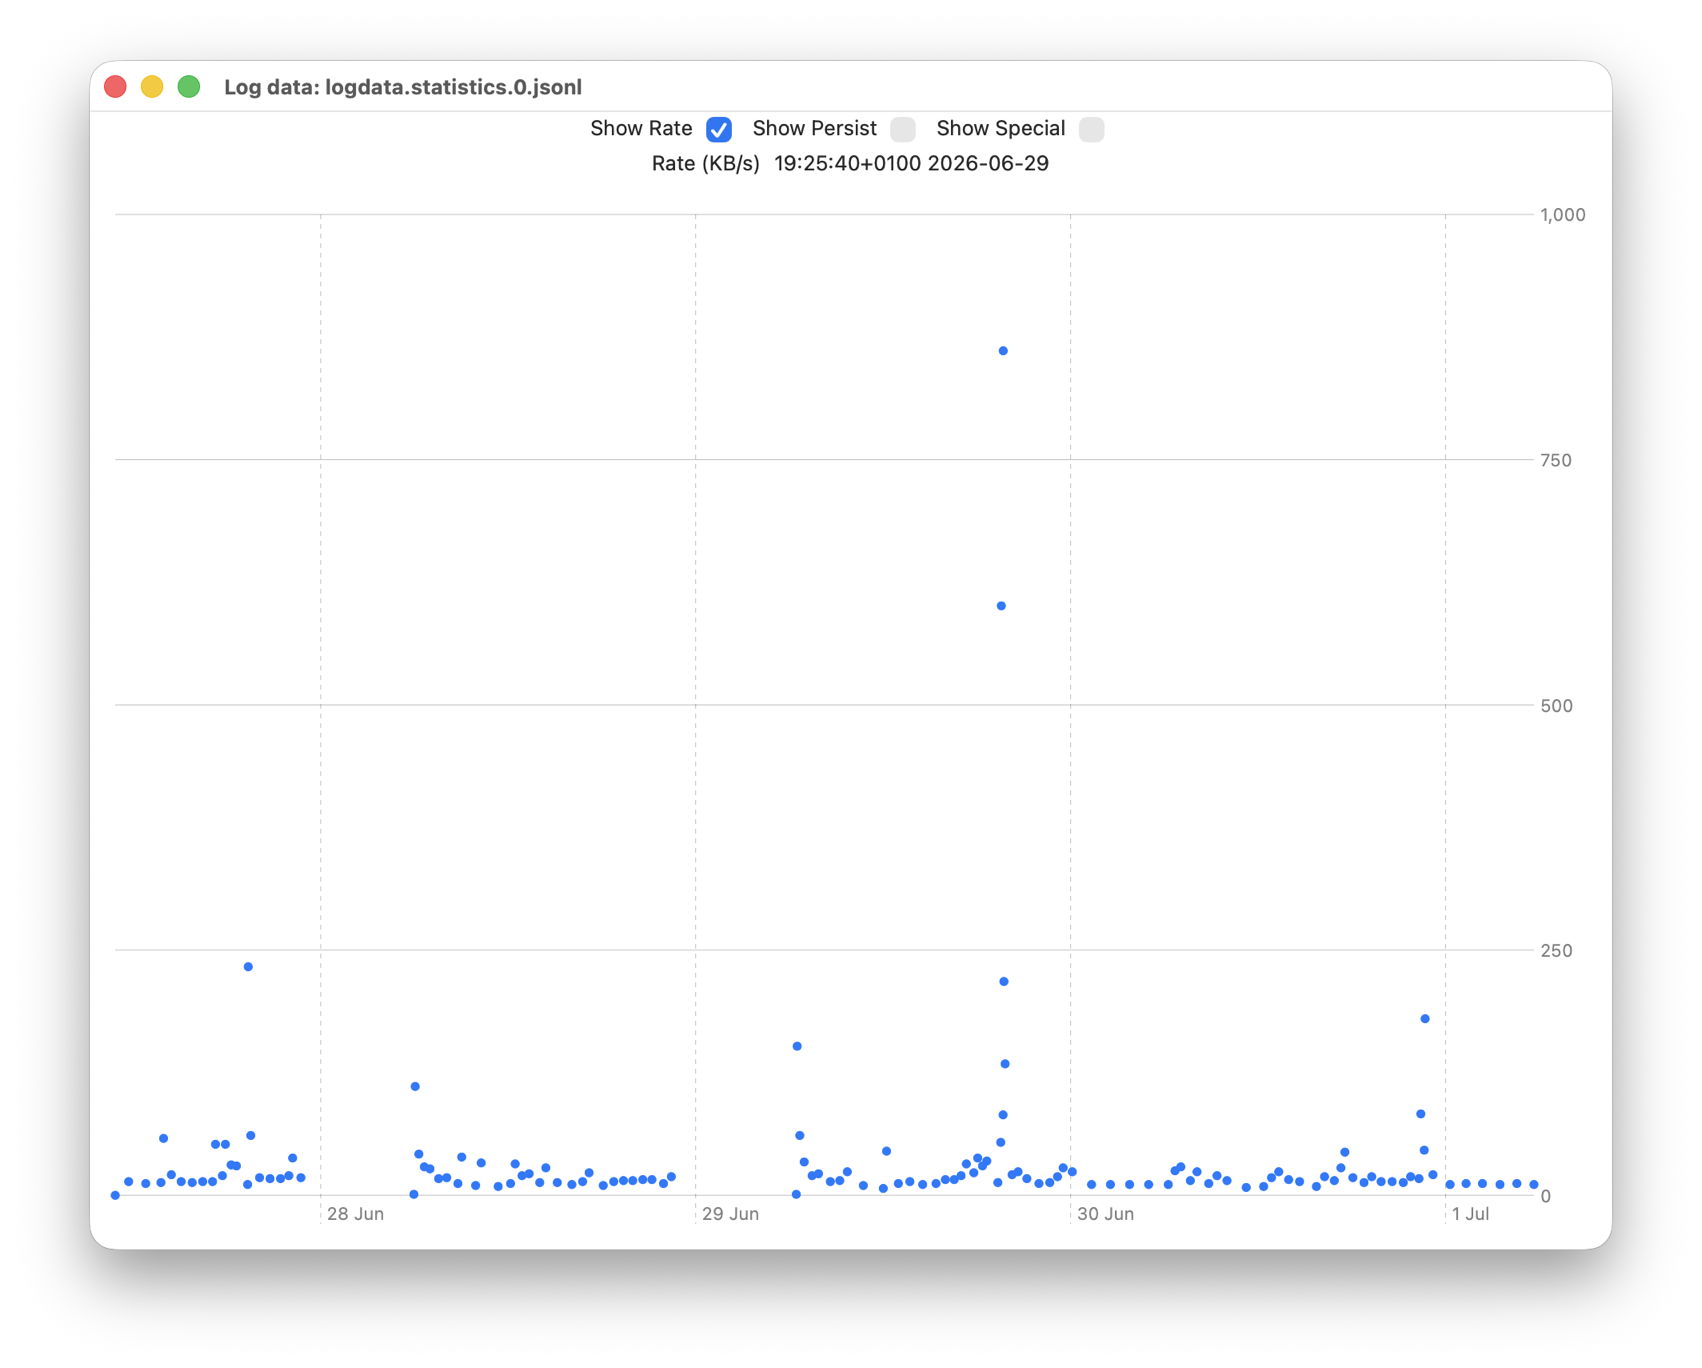
To exercise this new feature, I looked at a single log statistics file from my Mac mini M4 Pro covering a period of almost four days at the end of June 2026. This is of particular interest as it has some exceptionally high rates of log data being written to Persist files, and two periods in which the Mac was shut down, as shown in its point plot below.
Retention and purging of log entries
Log entries to be stored on disk are written to one of three files in /var/db/diagnostics:
- if they’re a Signpost entry, to the current open tracev3 file in /Signposts
- if they’re designated to be stored in a Special file, to the current open tracev3 file in /Special;
- otherwise, to the current open tracev3 file in /Persist.
The rules determining which entries go to Persist and which to Special files are set by subsystem and process in property lists in /Preferences/Logging folders in both /System/Library and /Library, and applied by logd when saving each entry from memory to disk. I don’t know of any way of distinguishing entries when they’re fetched from the log.
Log entries are purged according to which folder their tracev3 file is in. Those stored in the Persist folder are removed by the deletion of whole files to maintain the total size of files in that folder to around 530 MB. As those tracev3 files are each a maximum of about 10.4 MB size when compressed, that results in the retention of the most recent 50 or so Persist files.
logd purges entries in tracev3 files in the Special folder differently, progressively removing individual entries until there are none left in that file, when it’s deleted. Those files typically start at around 2.1 MB when they’re fresh, and can last up to about 3 weeks before all their entries have been removed.
Persist log files
In the sample analysed using Logistician, there were 133 Persist files covering a period of just under 4 days. These were imported as CSV into Numbers and analysed there to produce the following statistics:
- average duration was 2458 seconds, just under 41 minutes, with a standard deviation of 3291 and a longest period of 4598 seconds; thus 50 files would have covered a total period of about 34 hours;
- average uncompressed size was 37.5 MB, SD 6.5, and the largest at 87.9 MB; thus their average compression ratio was 3.6:1;
- average uncompressed log data rate was 40.2 KB/s, SD 96.5, and a maximum of 882 KB/s.
These are shown below plotted using DataGraph from the exported CSV file.
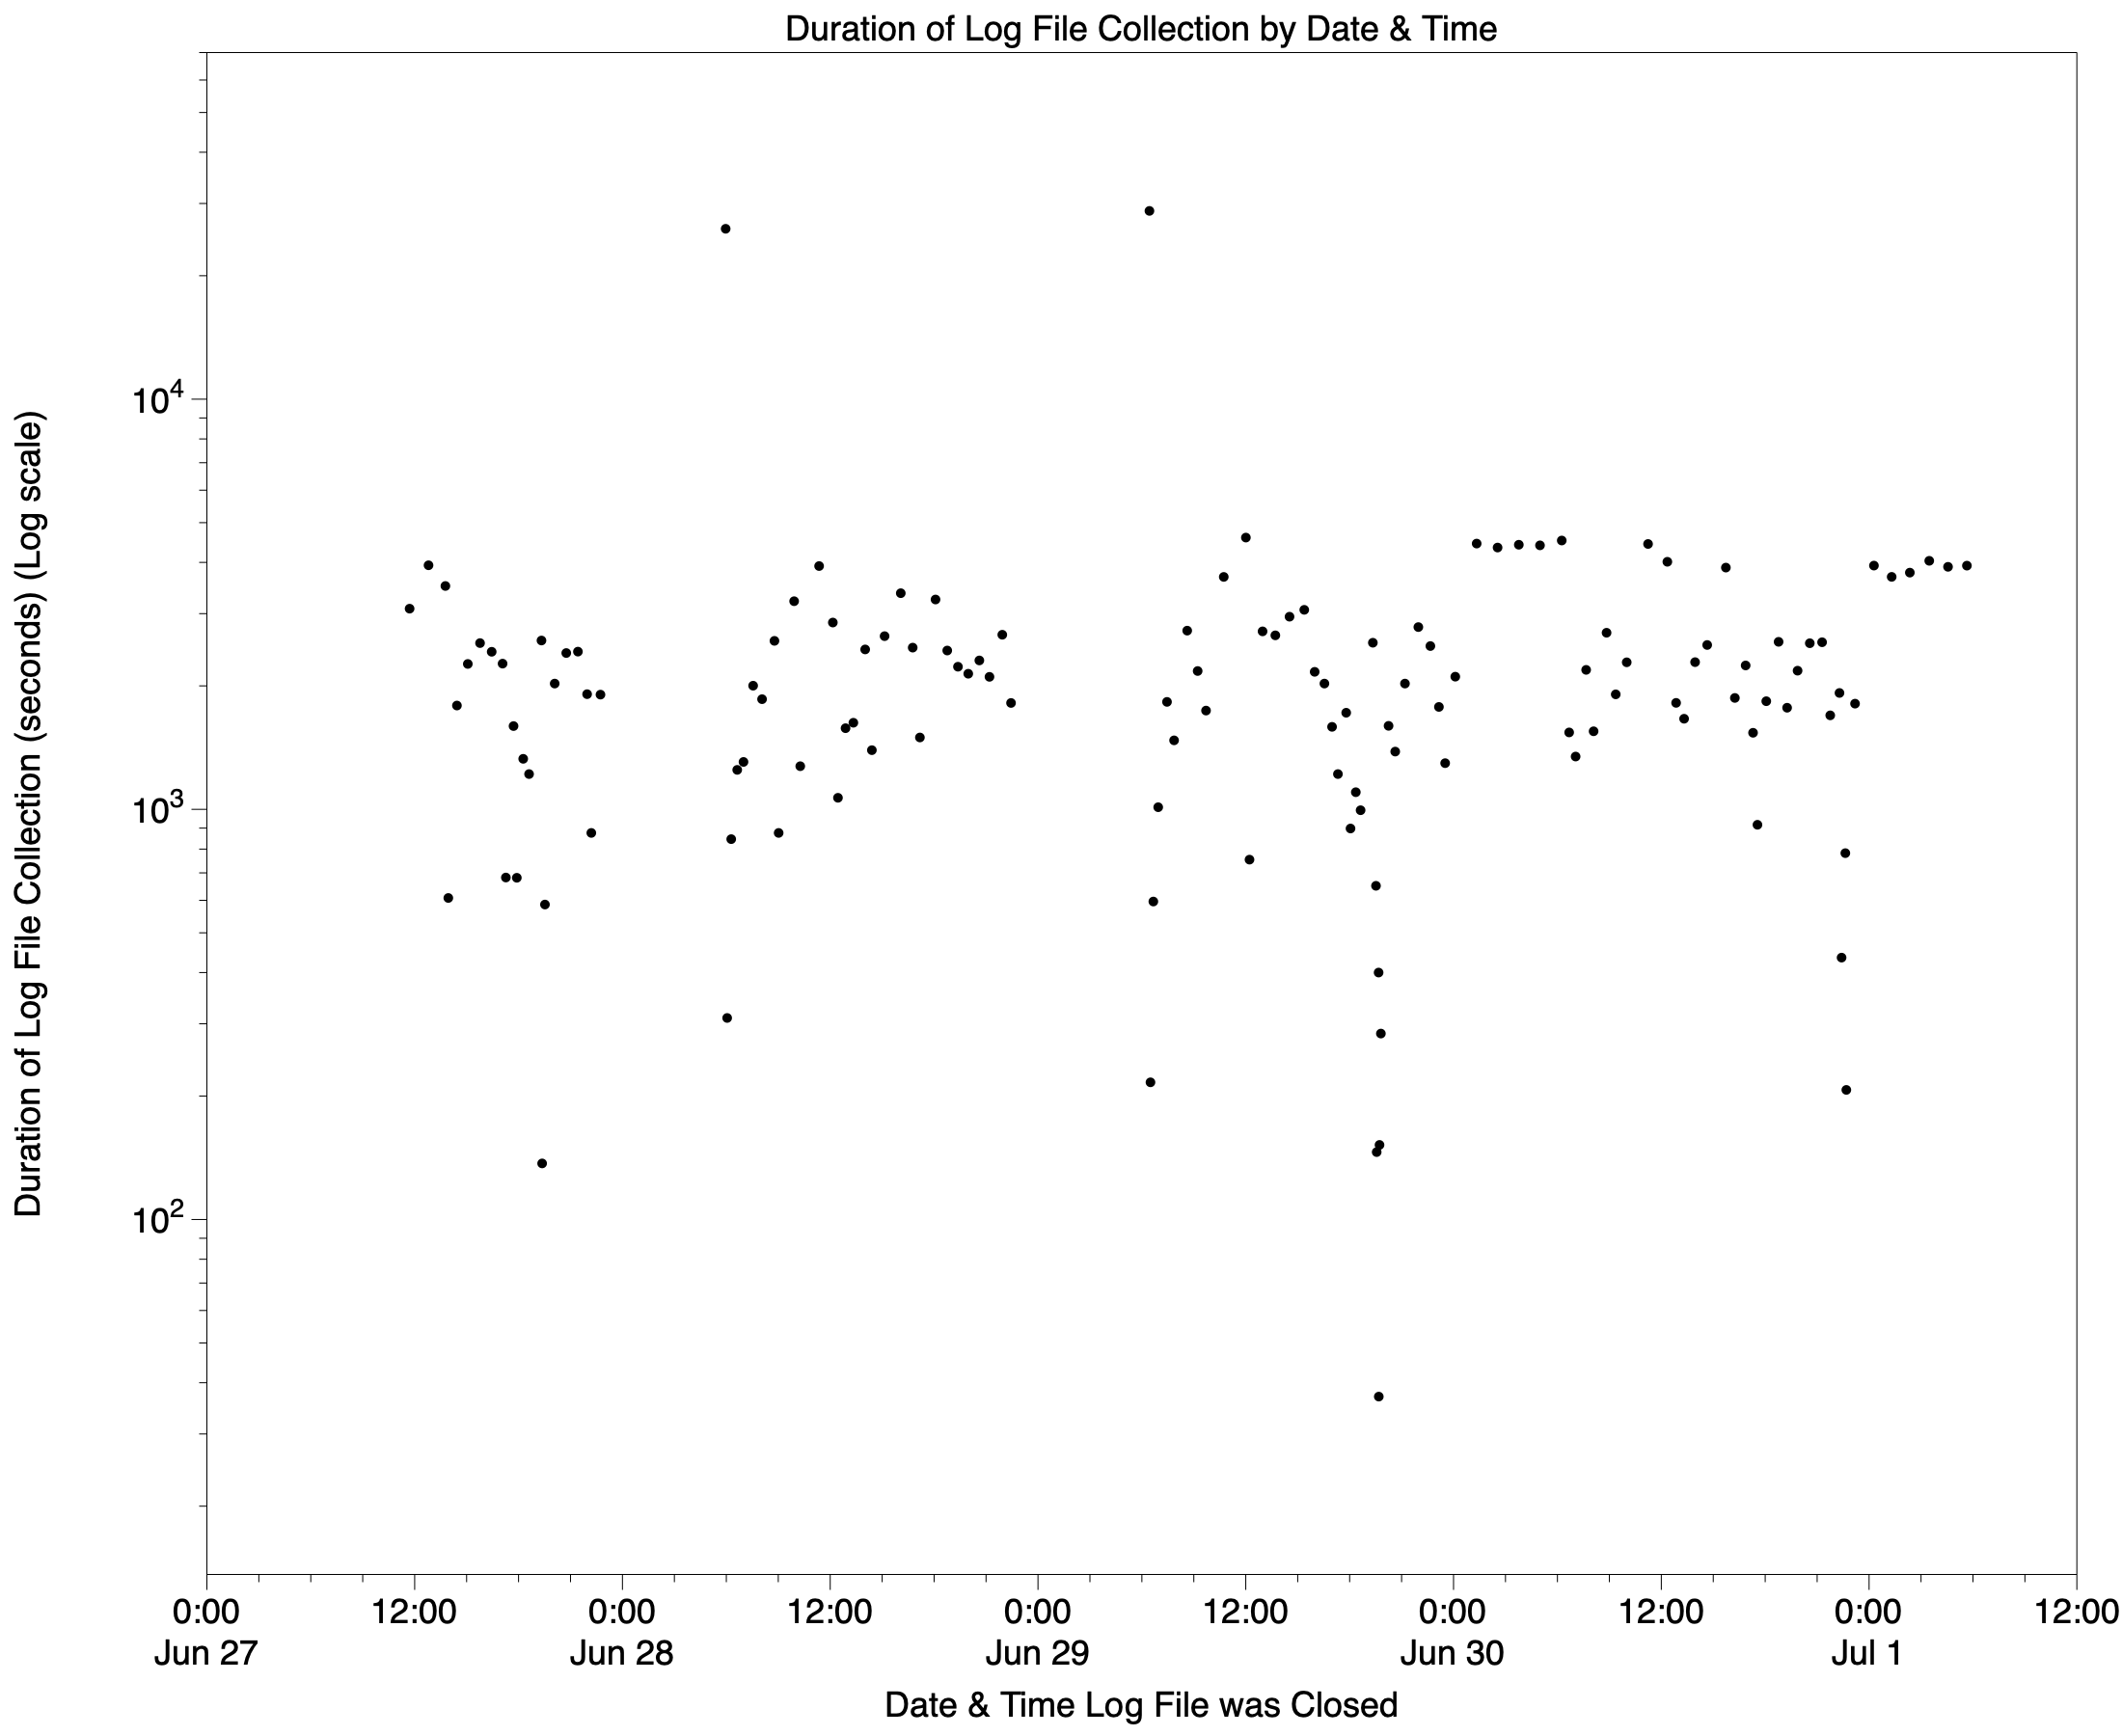
This graph shows the duration of each Persist log file over the period, using a log scale for the Y axis. Initial high values after the two periods of overnight shutdown are obvious artefacts. Two subsequent overnight periods show almost constant durations.
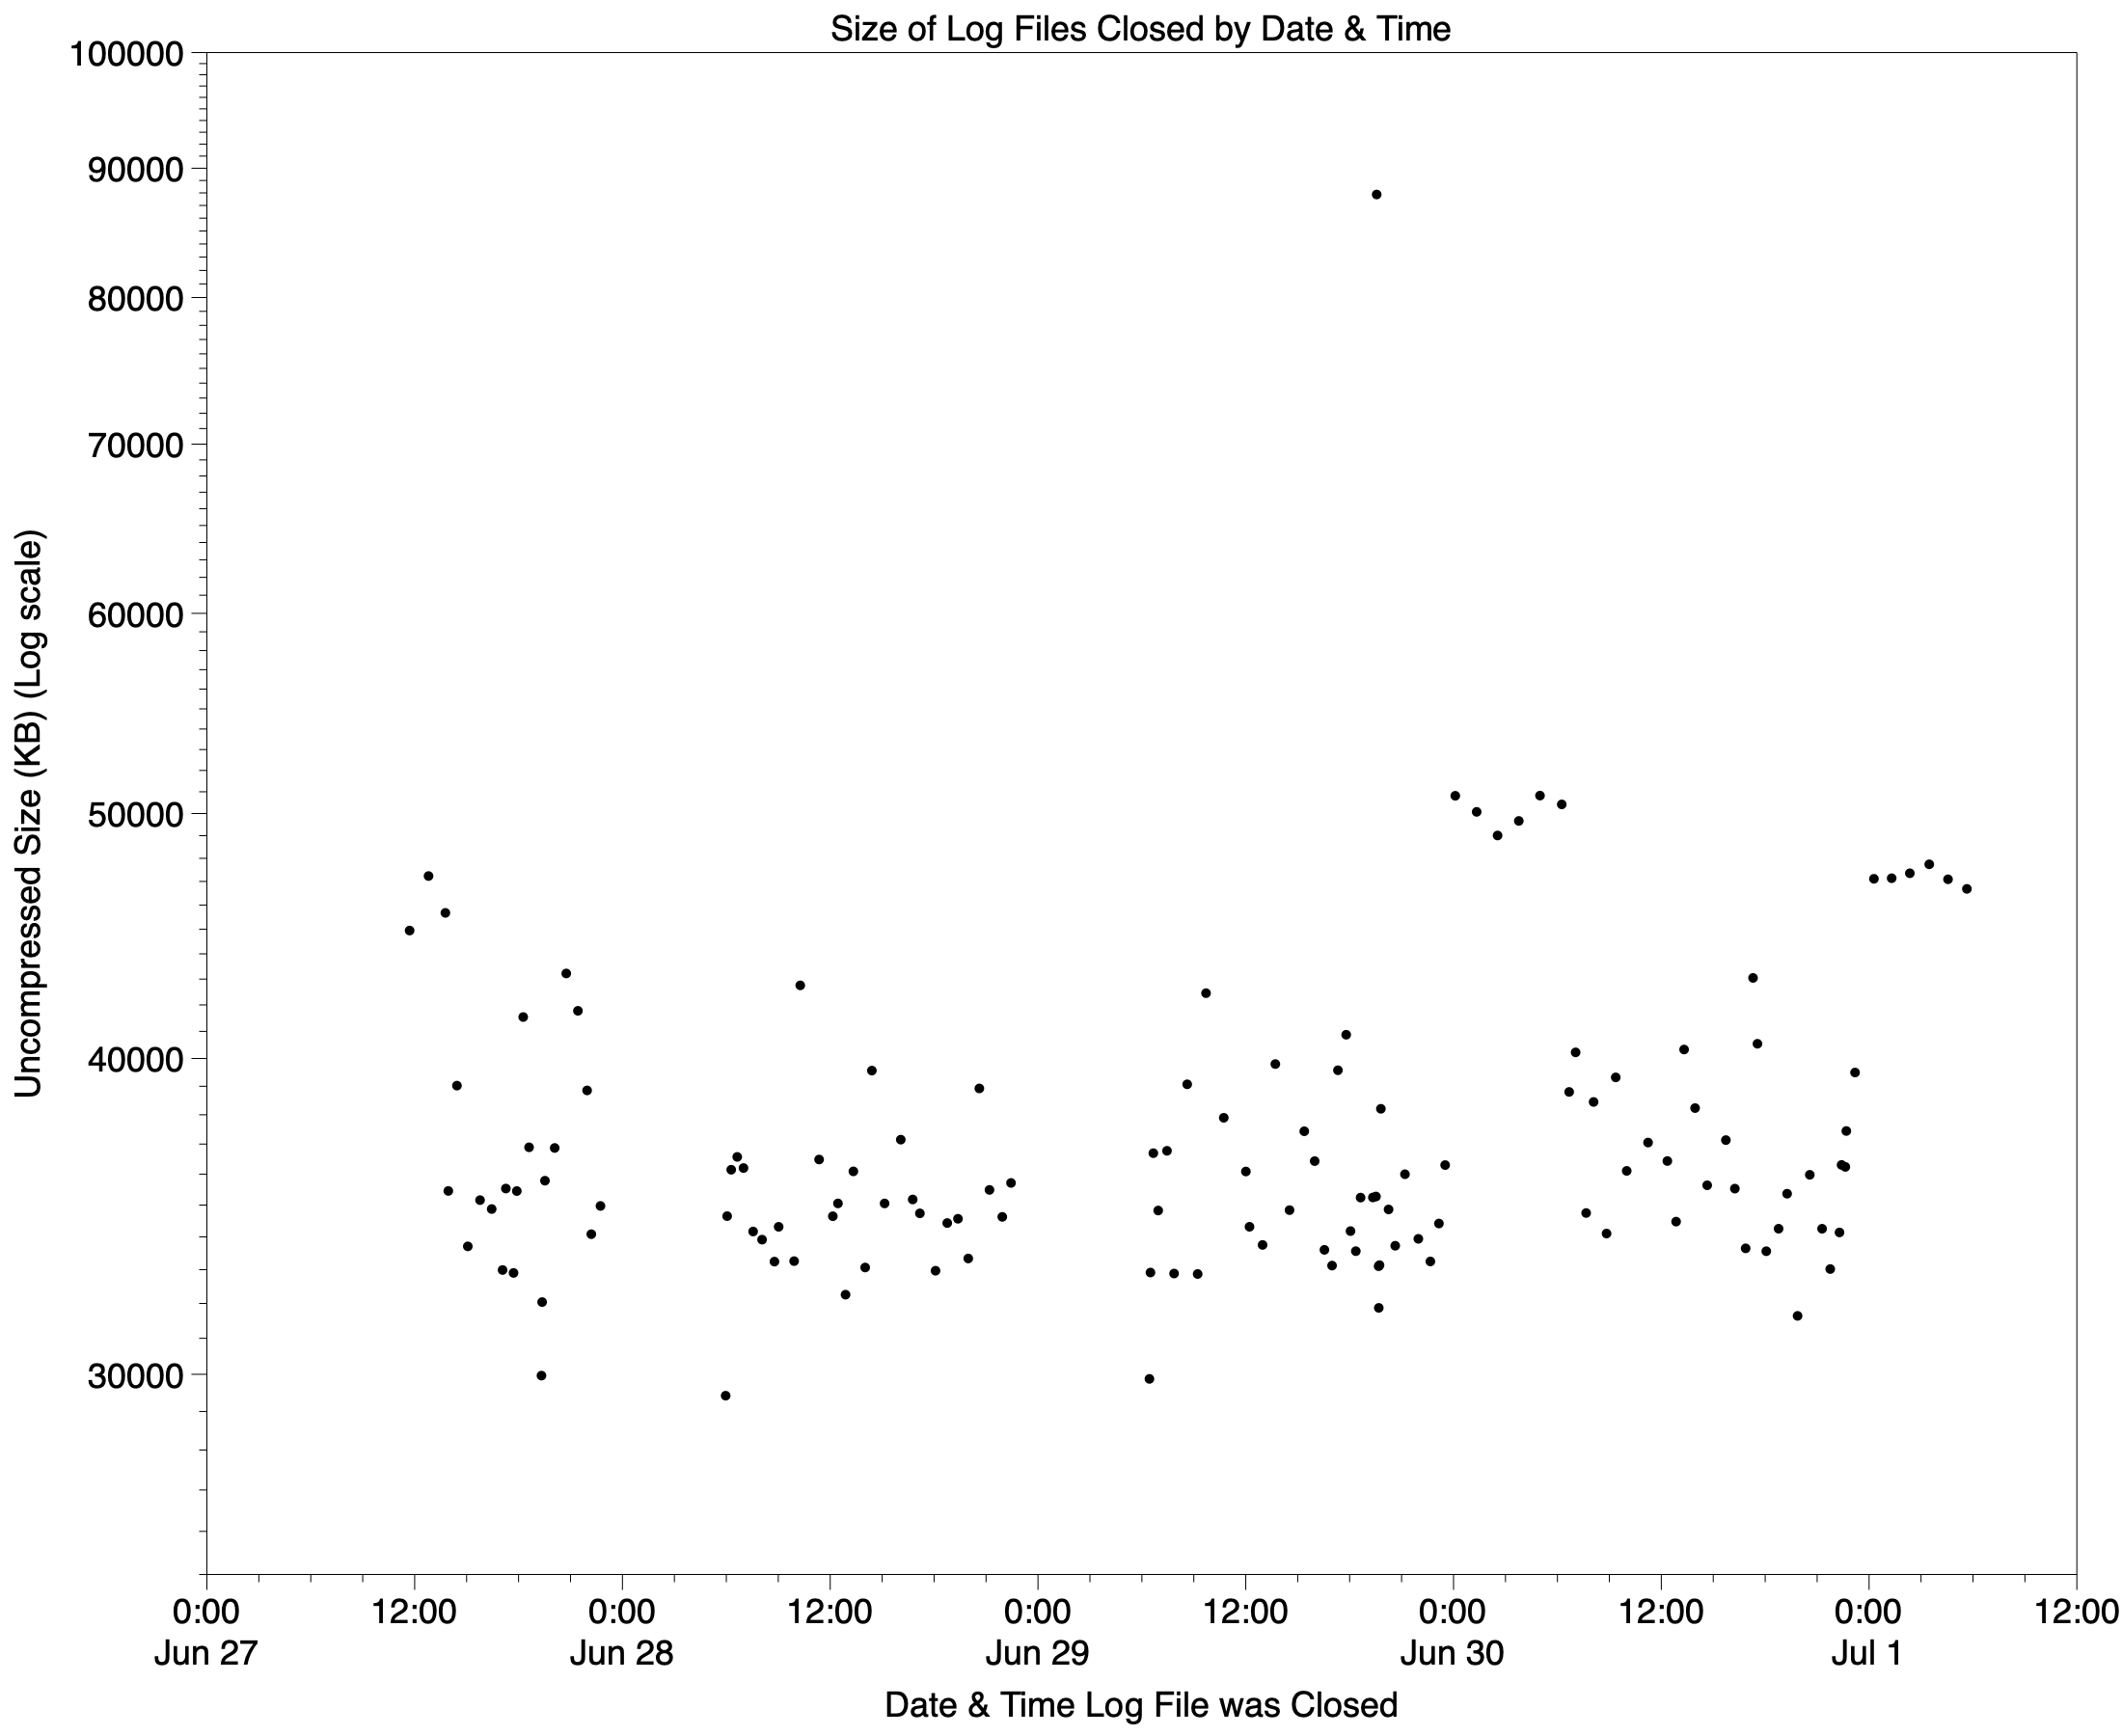
This graph shows the uncompressed size of data written to each Persist file, again with a log scale for the Y axis. The prominent high point is an event of interest, described below. Two series of six nearly constant sizes mark overnight running.
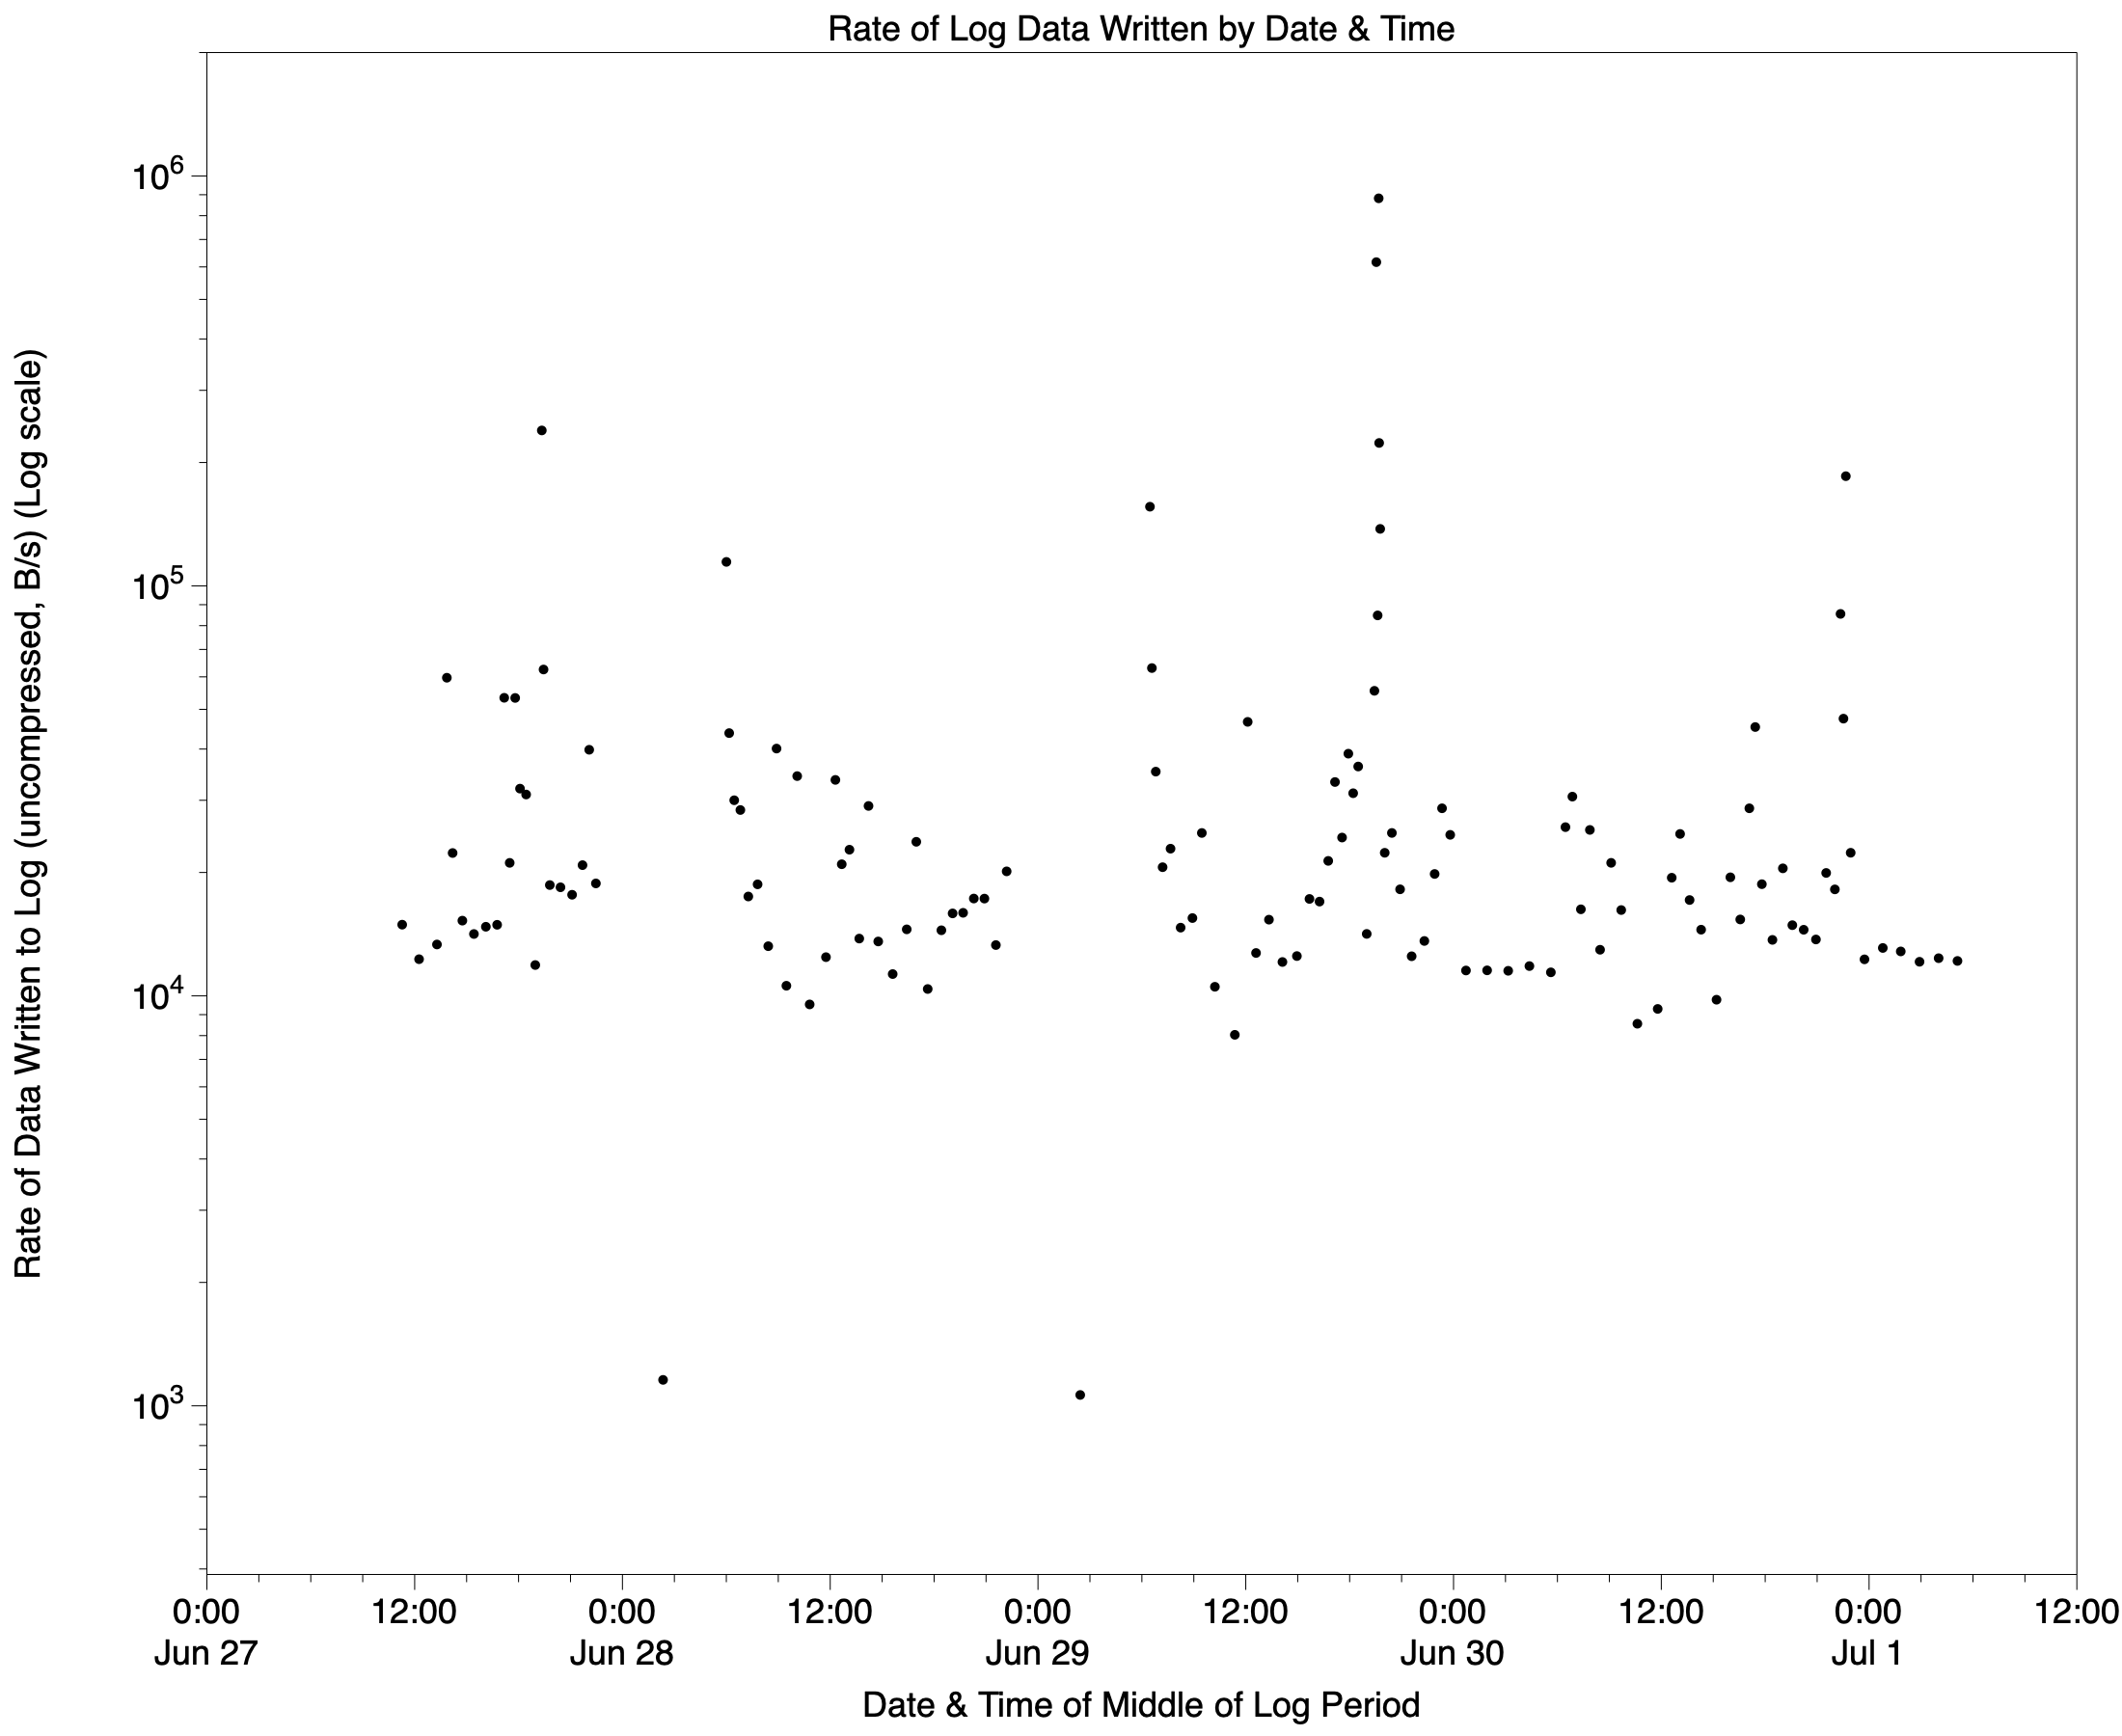
This graph shows the rate of uncompressed data written to each Persist file, with a log scale for the Y axis. In this case, values on the X axis are the midpoint of each file’s collection period. That results in the two very low rates seen overnight when the Mac was shut down, and near-linear periods when left running through the night. The scale of the event that occurred late on 29 June is clear.
For the first two nights of this period, the Mac was shut down between about 22:30 and 06:00, while it remained running and awake during the last two nights. Over those periods an additional 5-6 Persist files were written to the log, but there were no elevated rates such as those seen shortly after starting up in the morning following an overnight shutdown. There was thus no clear advantage in terms of accumulation of log files to shutting the Mac down overnight.
Rates of log entry
Data analysed by Logistician consists of quantities of uncompressed data written to log files, not the number or rate of log entries. To obtain estimates of those I used LogUI to capture all log entries for one minute periods during different activities:
- rates were low during the night, at around 2,500 entries/min
- during normal use, rates rose to around 6,500 entries/min
- short periods of intense entries were as high as 20,000 entries/min.
Note that those rates include those to both Persist and Special log files, but not Signposts.
At a rate of 6,000 entries/min to a Persist file for a period of 40 minutes, before the files are rolled, that would include about 250,000 entries, with entries of an average size of about 150 B uncompressed, or 42 B compressed.
When it’s gone, it’s not really gone at all
Logistician’s analysis drew attention to an exceptional log event at approximately 19:40 on 29 June 2026, several days before the oldest surviving file in the Persist folder. That coincided with the Mac being updated to Tahoe 26.5.2. Ordinarily, that would mean those log records were gone, and no more detailed analysis was possible. However, because the log is backed up by Time Machine, it was straightforward to obtain contemporary log folders from the first backup after that event, about 10 hours later, and convert those into a logarchive using LogUI.
That logarchive included the Persist log file noted above, in its catalogue as shown in LogUI, below.

In the contemporary logarchive, the peak of log entries was a rate of 58,217 entries/s, or just under 3.5 million entries per minute. Although by this time all Persist and many Special entries had been purged, accessing the same second on 5 July recovered 15,495 entries/s, or just under 1 million per minute.
These are shown in LogUI browser windows below, first for the logarchive, then for the current active log.


Browsing their entries alongside one another in LogUI confirmed that the more recent log entries are a subset of the originals in the logarchive.
Logistician version 1.3 for macOS Sonoma and later, including Golden Gate, is now available here: logistician13
from Downloads above, and from its Product Page, where you’ll also find LogUI.
Fun facts about the Unified log
- In normal use log entries may be written at a rate of around 6,500 per minute.
- During periods of more intense activity, rates can rise to 20,000 per minute.
- The peak rate can exceed 58,000 entries/s, or just under 3.5 million entries per minute.
- Persist log files in a Mac can store a total of over 10 million log entries. That’s more than 170 times longer than War and Peace.
- Its log files are normally backed up by Time Machine and other good backup utilities, from where they can be turned into a logarchive for full analysis and browsing, even many years later.

