

If you don’t know exactly what you’re looking for, and when it happened, the log has been a hostile place. Doom-scrolling through tens of thousands of log entries in the hope of stumbling across a clue is tedious, and the odds have been stacked against you. So last week I’ve been doing something to redress the balance and shorten those odds, and I’m delighted to offer its first version in Logistician. This has nothing to do with logistics, but is all about log statistics.
Alongside folders containing your Mac’s Unified log files, in /var/db/diagnostics, you’ll see files with names starting with logdata.statistics. A couple are text files that only go back a day or two, and others have the extension jsonl. If you were privileged to test some beta-releases of macOS Tahoe, you may have some database files as well, but here it’s those jsonl files I’m concerned with.
Inside them are basic statistical summaries of every log file that’s been saved in your Mac for the last few weeks or months. Even though the original log files have long since been deleted, summaries of their contents are still available in files like logdata.statistics.1.jsonl, and those are opened up by Logistician.
As the files in /var/db/diagnostics are still live, and may be changed as logd does its housekeeping, copy those jsonl files to somewhere in your Home folder, like a folder in ~/Documents. Open Logistician, click on its Read JSONL tool, select one of those copies and open it.

Logistician’s window displays the file’s contents in a list, with the oldest at the top. It gives the date and time that file was saved, just after the last log entry was written to it, its size in KB, whether it was a Persist (regular log), Special (longer supplementary log entries) or Signpost (performance measurements) collection, and the name of the file.
Select one of those file entries and click on the Chart selection tool at the top right to see its data plotted out in the Chart view.
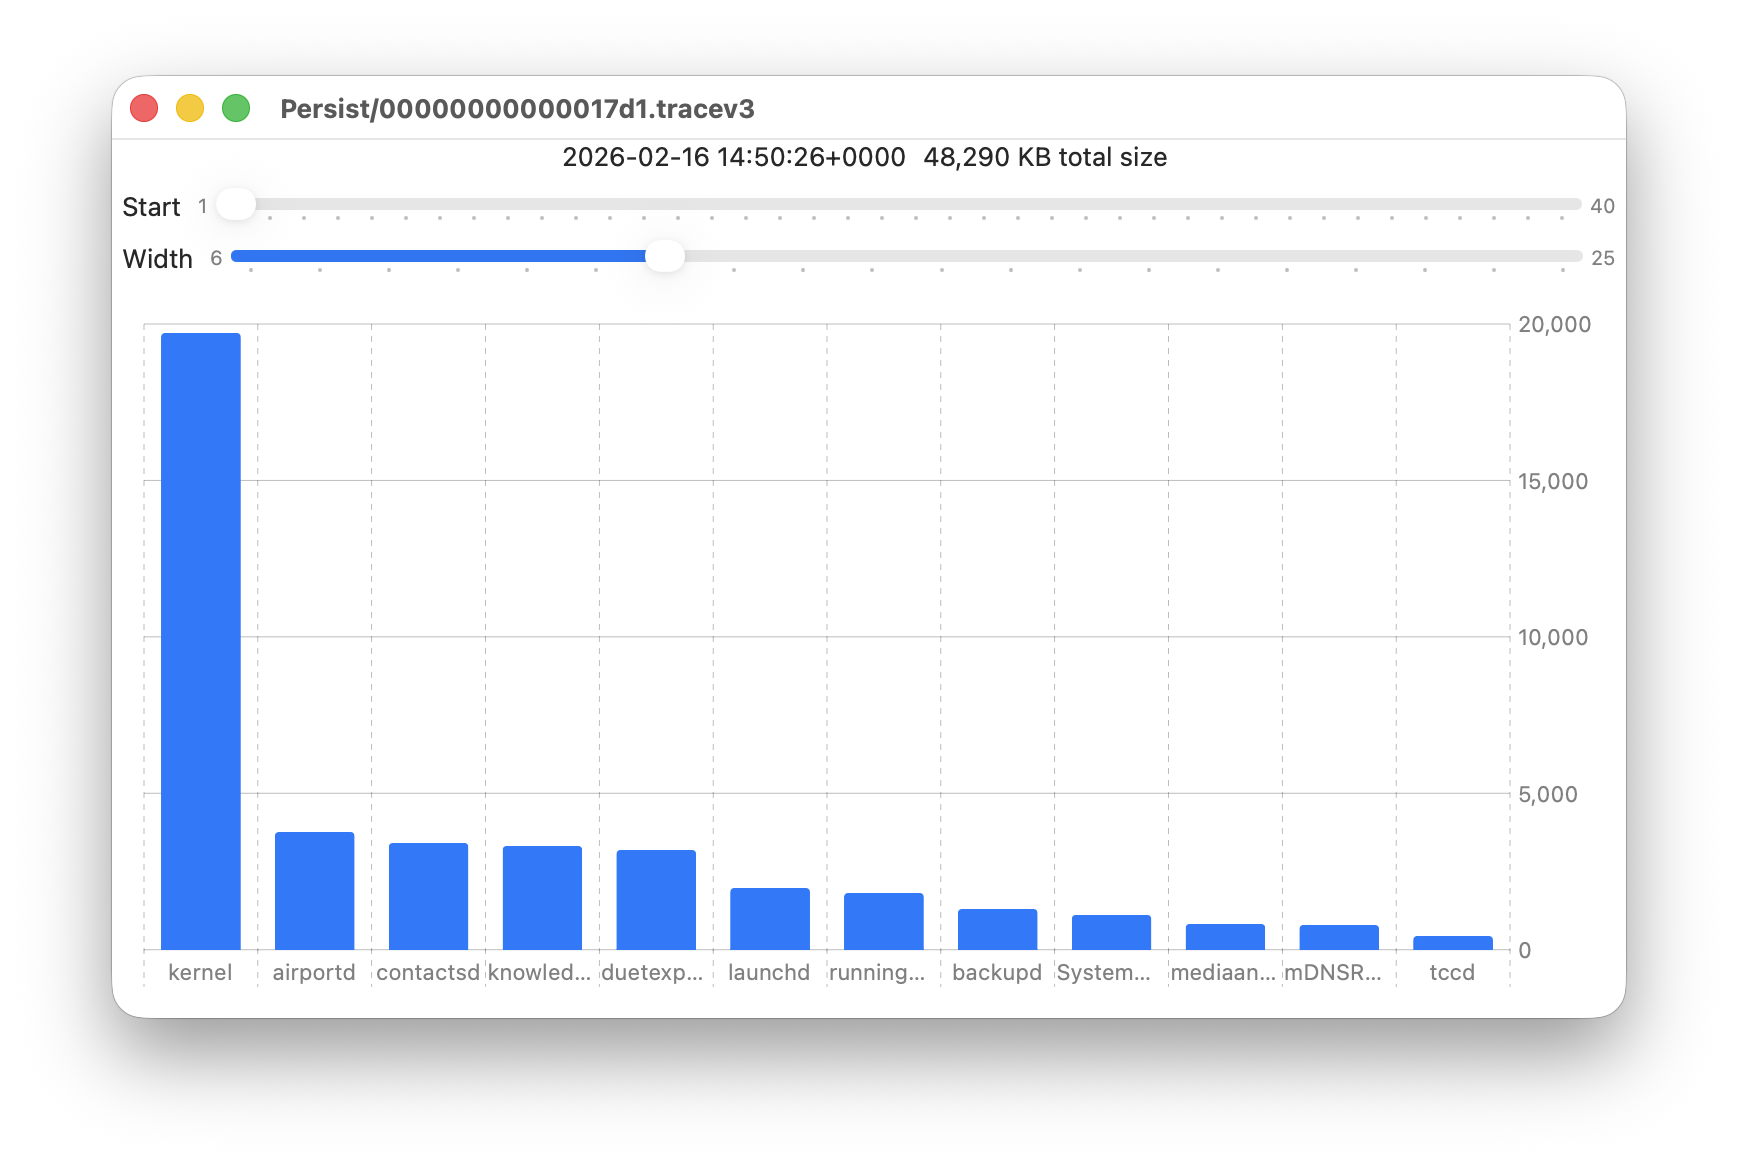
Data provided for each log file listed includes a breakdown of the total size of log entries from that process or subsystem, and Logistician’s Chart view displays those data as a bar chart. The height of each bar represents the total size in KB of log entries made by that process in that specific log file. As there are a 50 bars available, two sliders set the size and location of that window on the data:
- Start sets the number of the first bar on the left, beginning at 1 for the greatest size, usually the kernel, and increasing to 40 for a process with very few log entries, just ten from the smallest.
- Width sets the number of bars to display, ranging from 6 to 25. The more shown, the harder it is to read the names of processes at the foot of each bar, and the less precisely you can read the size of their log data at the right.
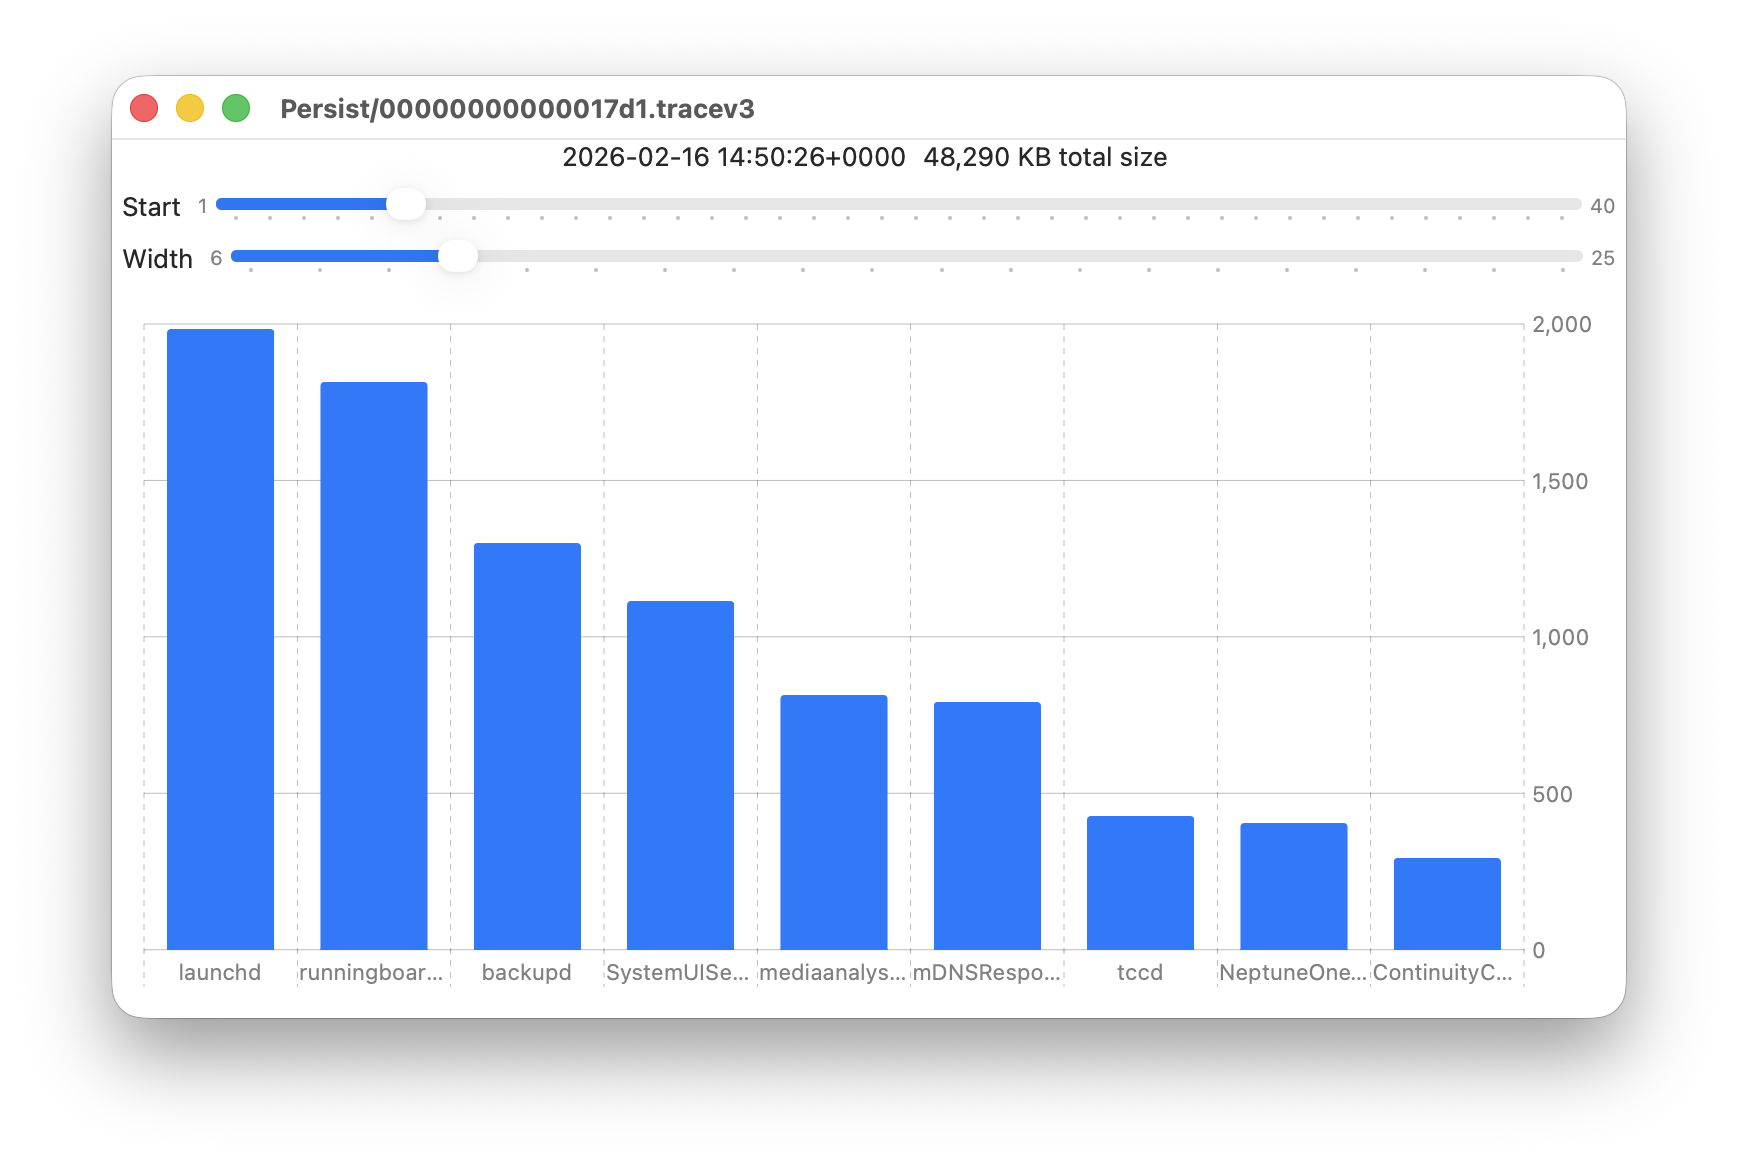
These sliders are set to show 9 bars from number 6 at the left (the sixth highest log data, written by launchd) to number 14 at the right (14th highest, written by ContinuityCaptureAgent). Of interest here are around 400 KB of log entries from NeptuneOneWallpaper.
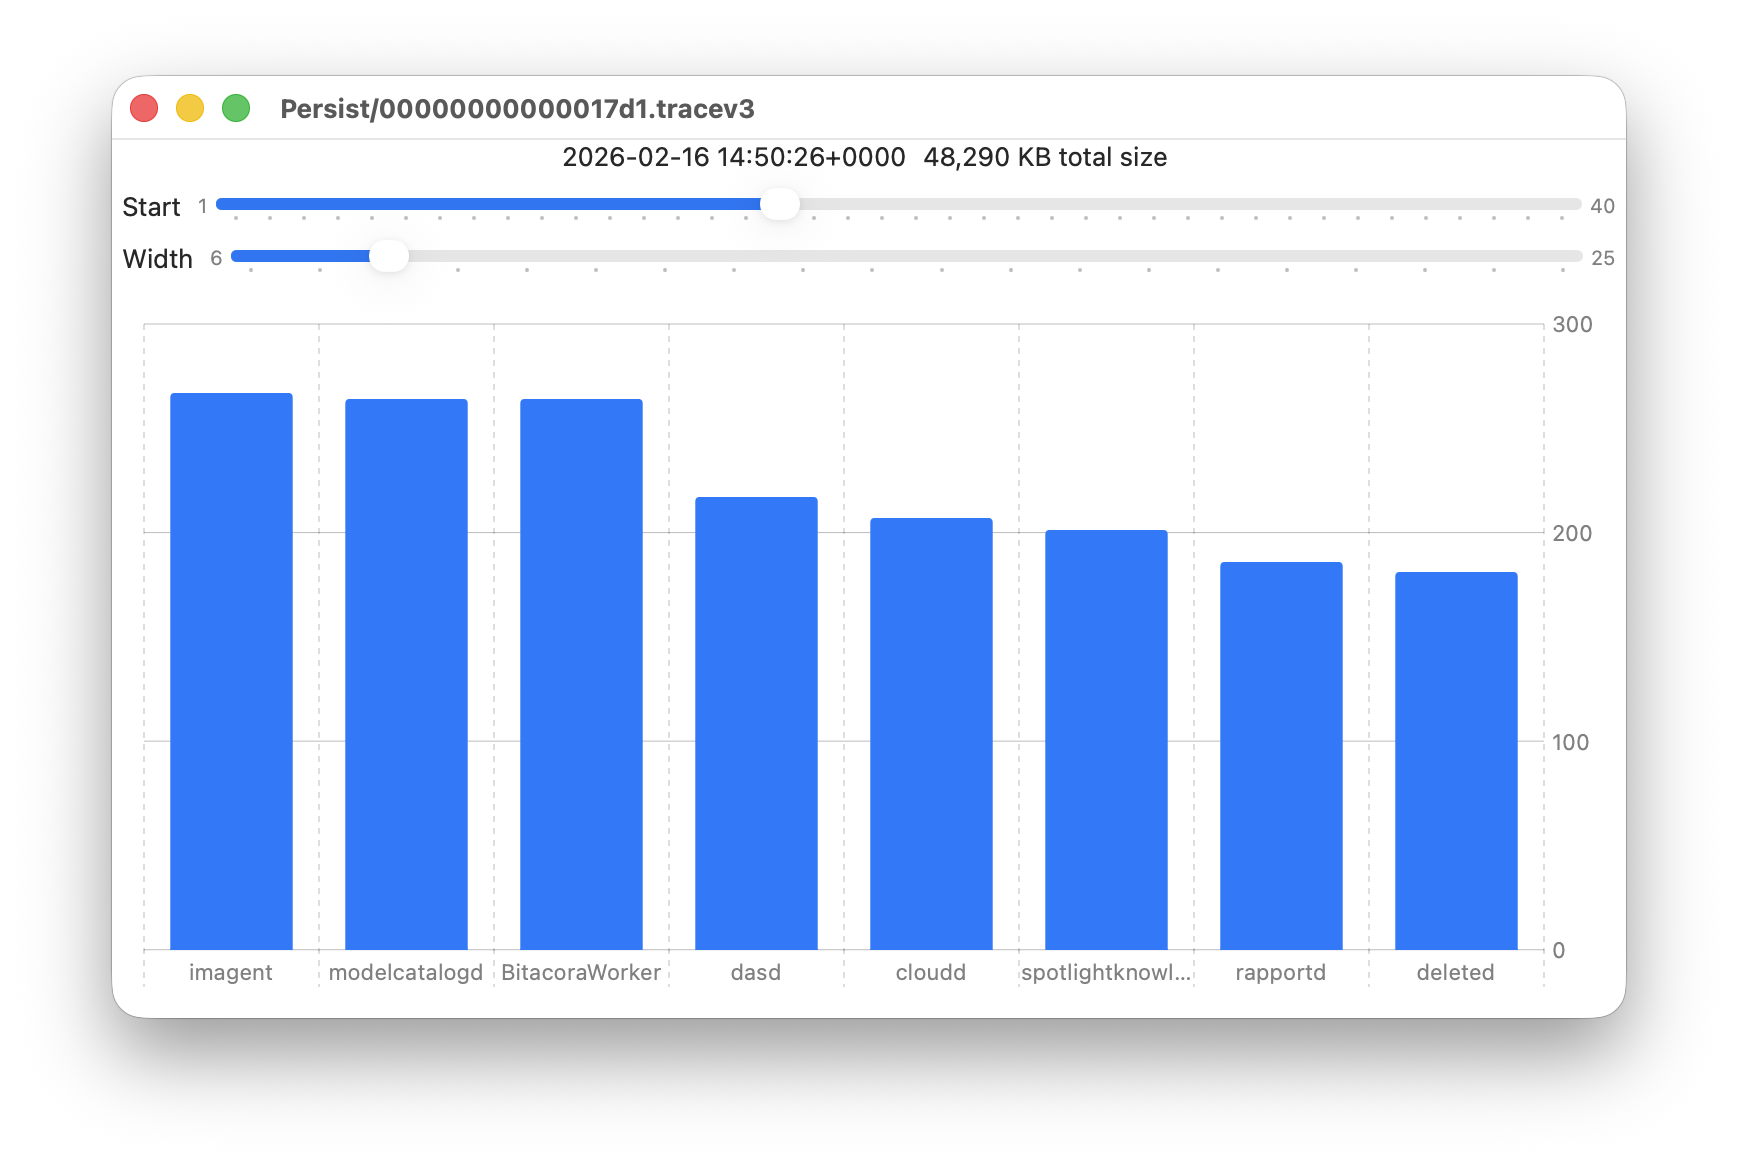
Here are 8 bars from 17 to 24, with smaller quantities written to the log of around 200 KB each. They include the DAS service dasd and cloudd for iCloud.
It’s easy to flip quickly through a series of log files: click on the next file you want to view in the main list, click on the Chart selection tool and values will be displayed immediately.
Fascinating though that might be, it doesn’t in itself answer many questions. Add a log browser like LogUI, though, and the combination helps you locate and identify unusual activity, problems, and specific events.
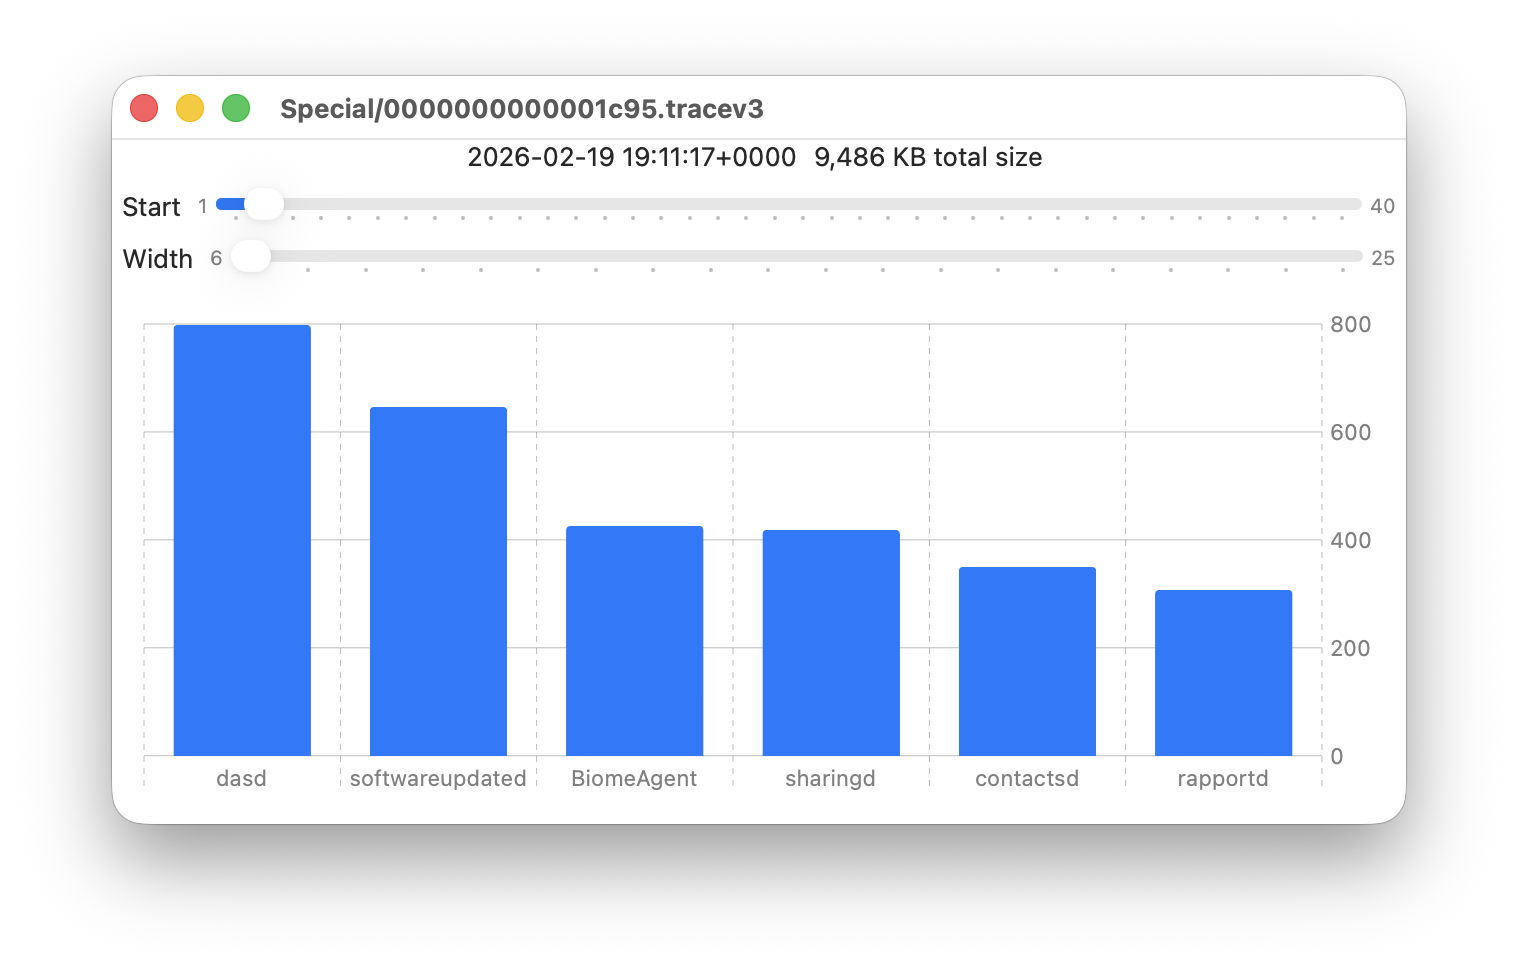
I happened to notice one Special log file that was closed at 19:11:17 on 19 February has high log data from softwareupdated. The previous Special log file was closed at 18:20:04, so somewhere between those times my Mac checked for software updates.
To ensure the full entries were still available in the log, I opened LogUI’s Diagnostics Tool to confirm that its earliest entries were a couple of days earlier.
I then set LogUI to a Start time of 18:20:04 with a Period of 600 seconds, and a Predicate set to a processImagePath of softwareupdated, to look for entries from that process. My first check located all the softwareupdated entries around 18:29:25, when I had apparently run SilentKnight. As a bonus, I discovered from those that SilentKnight was stuck in app translocation, so have been able to fix that (again).

Logistician version 1.0 build 7 for macOS Sonoma and later is now available from here: logistician106
I will add it to other pages here when I’m more confident that this initial version is stable and does what it claims in its detailed Help book.
Enjoy!
