
Lightweight virtualisation of macOS on Apple silicon Macs is intended to deliver performance close to that of the host, and tests I’ve performed bear that out. However, I gather that results aren’t easy to find. This article addresses that in a compilation of benchmark and other tests, comparing a VM with the M3 host it’s run on.
Results given here are from testing on a MacBook Pro M3 Pro (6 Performance + 6 Efficiency CPU cores) running macOS Sonoma 14.2.1 or 14.3. Virtual machines were created in Sonoma 14.2.1 or 14.3 using my free virtualiser Viable, and run in Viable with an allocation of 6 virtual cores, 16 GB of memory and bridged networking.
CPU in-core performance
Tests used were:
- empty loop, only incrementing an integer loop counter (assembly)
- integer arithmetic (assembly)
- floating-point arithmetic using multiply-add (assembly)
- NEON vector unit calculating a dot-product on two vectors of four 32-bit floating-point numbers (assembly)
- simd_dot, calculating a dot-product on two vectors of four 32-bit floating-point numbers (SIMD library)
- CPU matrix multiplication of two 16 x 16 matrices of 32-bit floating-point numbers (Swift)
- vDSP_mmul matrix multiplication of two 16 x 16 matrices of 32-bit floating-point numbers (Accelerate library)
- SparseMultiply, multiplication of dense and sparse matrices of 32-bit floating-point numbers (Sparse Solvers, Accelerate library)
- BNNSMatMul matrix multiplication of 32-bit floating-point numbers (Accelerate library).
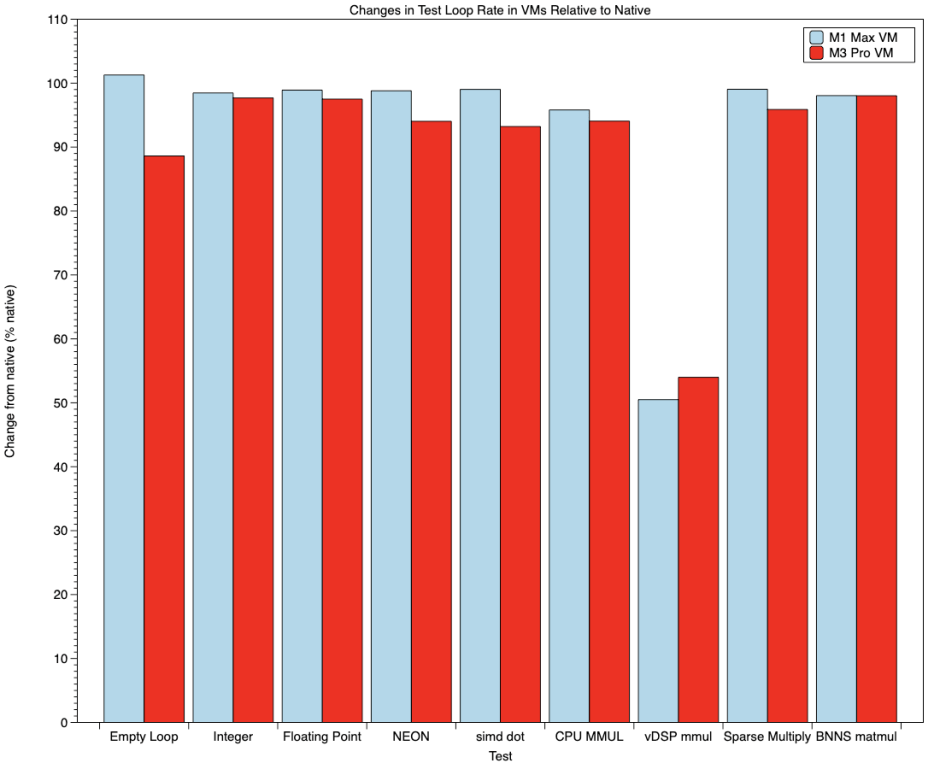
Bars in pale blue show results for a Mac Studio M1 Max, and those in red are for the M3 Pro. With some minor exceptions, and those for vDSP_mmul, VMs ran tests only slightly slower than the host. The empty loop ran slightly faster on the M1 VM, but ran rather slower on the M3 VM. Otherwise VMs ran at 93-99% of native speed, regardless of whether the test used integer, floating-point or NEON units in the core. The most obvious and greatest exception to that were the results of vDSP_mmul matrix multiplication, which showed a marked reduction in performance to about 50% when virtualised on both chips. This was seen in both single thread tests and when running 4 threads at a time.
Geekbench
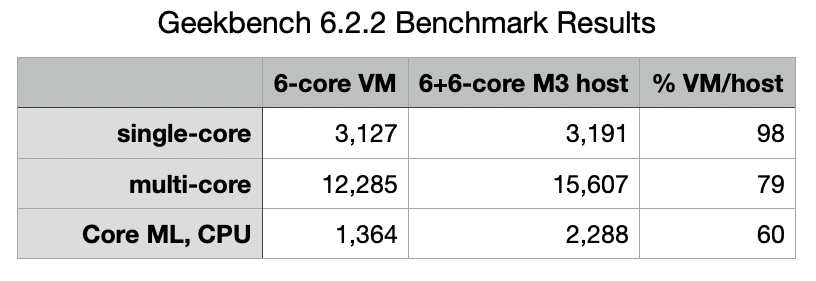
Results obtained from Geekbench 6.2.2 and Geekbench ML 0.6.0 are given in the table above. Single-core performance of the VM was 98% that of the host, which bears out the results of the in-core performance above. Multi-core performance of the VM was of course limited by the 6 cores allocated to it, although as VM threads are preferentially allocated to the P cores of the host, the VM still managed to achieve almost 80% of the host’s score.
At present, Geekbench 6 is unable to benchmark Metal GPU performance in macOS VMs.
Geekbench ML offers the option of running its benchmarks on CPU, GPU or the neural engine, but VM scores for those were almost identical, making it apparent that only the CPU could be used there. For comparison, the host GPU returned a score of 7,657, and the neural engine an amazing 10,176.
Disk transfer
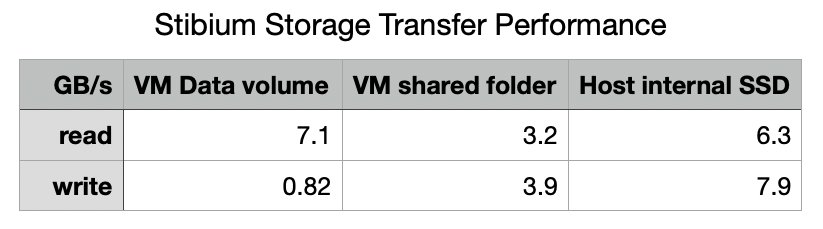
Disk read and write speeds are given in the table above. There are two sets shown for the VM: the first is for transfers with its Data volume, stored in its Disk Image, and notoriously slow for writing. The second option shows rates when accessing a shared folder on the host, where they’re rather better than Thunderbolt 3, but only about half those achieved by the host to its internal SSD.
Network
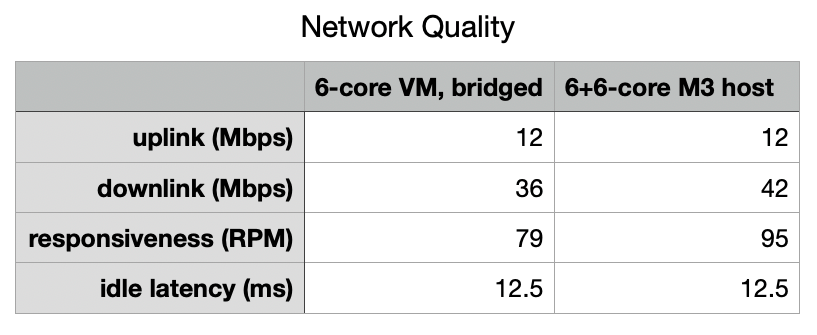
Using bridged networking for the VM, local network connections were limited to the 1 Gbps available over the wired Ethernet connection, and should make full use of faster connections when available. Internet responsiveness was measured using the networkQuality command tool (without iCloud+ Private Relay), and those results are shown in the table above. They’re very similar between guest and host.
Summary
- With a single exception, in-core performance across integer, floating-point and vector processing (NEON) is only slightly slower in the VM than in the host.
- The Geekbench 6 single-core benchmark is also very close to that of the host, but the multi-core benchmark is limited by the smaller number of cores available to the VM.
- Disk write speed to the VM Disk Image is very slow, but both read and write speeds to shared folders are faster than Thunderbolt 3.
- There’s no evidence of significant impairment of network transfer when the VM uses bridged networking.
- Lightweight virtualisation of macOS on Apple silicon does deliver performance that’s impressively close to that of the host.
