

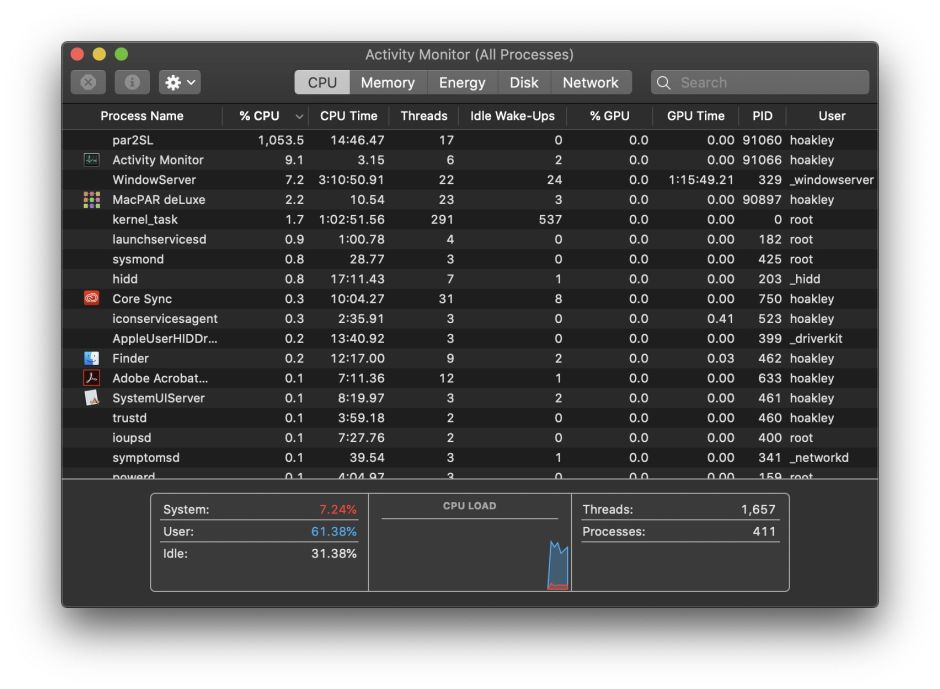
Other than apps using excessive memory, the other main cause of Macs slowing down is a process hogging the processor and using excessive CPU. In this case, the diagnosis is made by opening Activity Monitor, selecting its CPU view, ordering the processes there by clicking in the header of the % CPU column, and seeing the offending process is consistently using more than 100%.

This may be accompanied by the spinning beachball, a juddery interface, and any cooling fans running at full pelt.
Diagnosis
To view all processes in Activity Monitor, you’ll need to switch its View menu to All Processes, or those of the system may be hidden. You may also see the % CPU column ordered with 0% at the top, in which case click again in its header to bring the highest to the top.
As all Macs now have multiple processor cores, the next thing to do is show the floating CPU History window, from the Window menu.

Apple silicon Macs have two types of cores: those designed for Efficiency (E cores), and those for Performance (P cores). macOS uses these for different purposes, normally running system and background processes mainly on the E cores, and user processes on the P cores. This delivers the most efficient energy use and responsiveness to user tasks. So it’s not uncommon to see the E cores maxed out for quite long periods when undertaking demanding system tasks like making large backups, or rebuilding Spotlight indexes. But what you should experience is more dependent on how heavily loaded the P cores are, as those bear the brunt of what your apps are doing.

Intel Macs show twice the number of cores in this window than they actually have, as the set on the right (with even numbers) are the same physical cores as those on the left (odd numbers), but using Hyper-threading, when they boost to double their throughput. Intel Macs don’t have different core types, and normally just spread the load as evenly as possible, engaging Hyper-threading when they’re pushed to the limit.
In both architectures, the bars in their CPU History are coloured red for system processes, and green for user processes. Although given as percentages, the total percentage isn’t 100, but 100 for each core. So an Intel Mac with 8 cores running flat out will peak at 800 for normal threading, and another 800 for Hyper-threading, making 1,600. An Apple silicon Mac with 8 P cores and 2 E cores will peak at 1,000, even though the maximum throughput of each E core is around a third of a P core.
Now you can interpret what is shown as % CPU, look at the process that’s hogging your Mac’s processor.
kernel_task
If it’s kernel_task, then it almost certainly means that your Mac is getting hot, not that there’s a problem with the kernel.
Your Mac’s thermal sensors are monitored by a sub-system named Core Duet, which together with the SMC (in Intel Macs only) manages its internal environment and services. When a process runs away and takes over the cores, or any of the internal thermal sensors registers an abnormally warm temperature, Core Duet responds with a set of actions to try to keep it cool. These include its active cooling system of fans, which are run up to speed to blow cooling air over the most sensitive components, and easing off CPU load. Where possible that slows processor speed, and blocks any runaway processes by occupying the CPU with kernel_task.
So kernel_task’s high load isn’t a cause of the problem, it’s part of the normal cooling response, as Apple explains.
In the past, some users have taken to meddling with this system, by trying to stop kernel_task from doing its job. That’s a bit like stopping someone who’s sweating because of the heat from drinking to replace their fluid loss. It will only make matters worse.
When the fans get loud and kernel_task hogs your CPU, it’s time to do all you can to let your Mac cool down. Ensure its vents are unblocked, and cooling air can enter and exit freely. Quit Activity Monitor and anything else that might increase its thermal load.
There are rare occasions when fans blow full on and kernel_task goes wild without any thermal problem. In those cases, resetting the SMC is usually curative for Intel Macs, but it may be the result of a fault in a thermal sensor, or in the SMC itself. Hardware diagnostics are usually helpful, or one of several apps which let you check on sensor readings. By far the most common cause of more persistent problems, though, is dust and debris in the air ducts.
Other processes
If the CPU-hogging process isn’t kernel_task, make a careful record of what happened in case you need to refer to this later, perhaps when dealing with a software support line.
Before deciding what to do with the runaway process, consider what it’s doing and the consequences of shutting it down. Some of the regular offenders include:
mdworker,mdworker_sharedprocesses, which are multiple, andmdsitself. These are the macOS metadata services that compile and maintain Spotlight indexes.distnoted, a background service handling distributed notification for many processes.- WindowServer, responsible for compositing individual windows into the display image, and routing events such as clicks/taps to the correct app. Without it, there’s no GUI and no control over it, so you should never try to restart or kill it.
- Safari and its components, and other web browsers.
If you decide that you do want to quit the app or process, try these in order of preference:
- Bring an app to the front, and quit it normally after saving any open documents, if that still works.
- Open the Force Quit dialog using Command-Option-Escape, select the app there, and click the Force Quit button. Although this should be gentle force, any unsaved documents are likely to lose their recent changes.
- In Activity Monitor, select the app or process and press Command-Option-Q. This will definitely lose any unsaved changes in documents. Never try doing this with
kernel_task, of course. - If you know what you’re doing in Terminal, you can kill the app or process there if you prefer.
If that isn’t appropriate or doesn’t work, the next least disruptive thing to try is closing all your apps, saving what you can on the way, then logging out and back in again. For some types of problem this may the best solution. Next in line is to simply restart your Mac. This may be a first choice if, like me, you normally leave it running (even if asleep) for several days at a stretch.
If your Mac is still sluggish and unresponsive after restarting, try a Safe boot, to flush many of its caches and clean up temporary files and other junk. While this is simple on an Intel Mac, where it’s initiated by holding the Shift key during startup, Apple silicon Macs can only enter Safe mode from Recovery, so you’ll need to shut down, then start up with the Power button held to load Options. Once the Mac has started up and is offering one or more disks, select the disk you wish to boot from in Safe Mode, then press and hold the Shift key and click Continue in Safe Mode underneath it.

If you find an app repeatedly maxes out your Mac’s cores, then inform its developer, with as full details as possible, so they can do something about it.
Summary
- Diagnose using the CPU view in Activity Monitor, supplemented by the CPU History window.
- Identify the process responsible.
- If that’s kernel_task, it’s an indicator that your Mac has got too hot. Remove other processes contributing to the thermal load, clear air ducts and encourage cooling. Never interfere with kernel_task, as it’s trying to get your Mac cool.
- Consider quitting or killing other runaway processes, apart from WindowServer.
- Otherwise log out and back in again, or restart.
- Inform the app developer.
