
In my first article about Apple Archive (AA), I explained how it came about, how to access it, and what it offers the Mac user. Where I stopped short was in detailing its performance, how the user can control that, and its energy use.
There are only two controls over AA’s performance: the Quality of Service (QoS) it’s run at, and the number of threads it’s allowed. Apple appears to have another private control used during the preparation phase of macOS updates which confines decompression and other tasks to a single P core, but that isn’t generally available.
While QoS is inherited from the thread which calls AA functions, they are run in separate threads whose numbers are controlled when calling AA functions. Unless an app exposes both QoS and thread count controls to the user, AA’s work will be performed at high QoS and with one thread per processor core. While this delivers good performance and gets the job done, it will limit the performance of other threads contending for core access. There is a good case, on Apple Silicon Macs at least, to allow users to adjust that, and to be able to run AA’s threads exclusively on E cores for greatest energy efficiency.
Performance
The effects of QoS are less on Intel processors, which also lack different types of cores. While controls could be useful there, I here concentrate on their effects on M1 Pro and Max chips, which in these respects are essentially identical. To assess the relationship between the number of threads (thus of cores) and performance, I modified my AA compression utility Cormorant to allow thread numbers to be set, as well as QoS. I then repeatedly compressed the same 10 GB test file using different numbers of threads and QoS settings.
These can be visualised using Activity Monitor’s CPU History window. This first example shows CPU % for a series of 5-10 threads at a QoS of 33.

This example shows a series at a QoS of 9, with all activity being confined to the two E cores at the top.

Results are shown in this graph of compression rate (GB/s) by the number of threads.
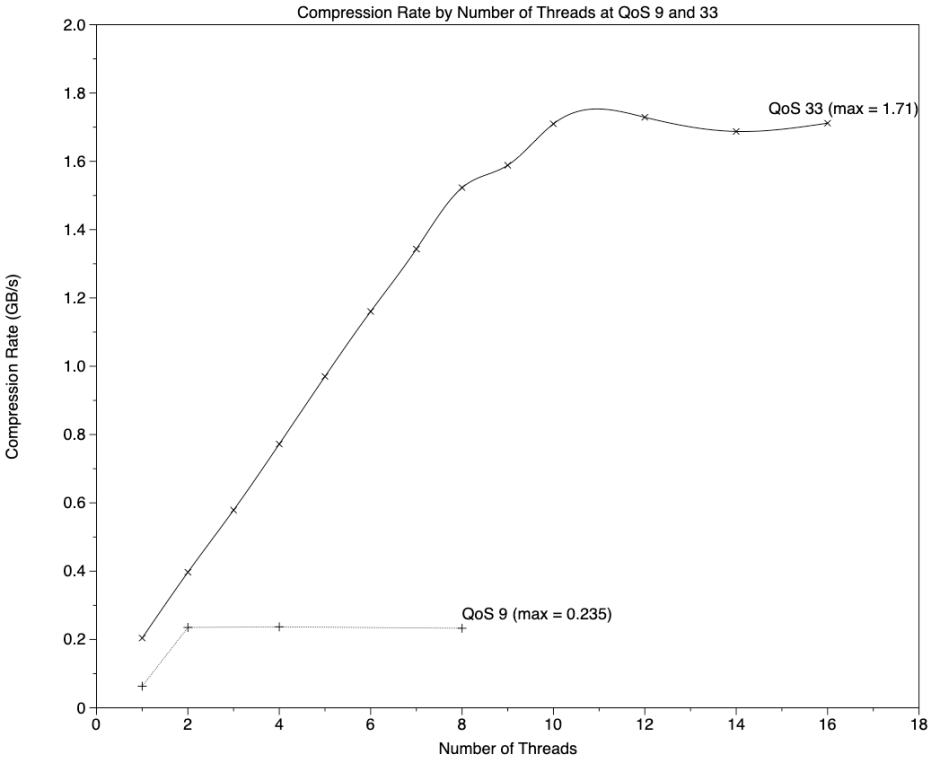
When running the compression task at a QoS of 33, giving threads access to both P and E cores, compression rate rises linearly to a maximum at 8 threads (the number of P cores), at which stage all the P cores have 100% active residency. Each thread added up to that maximum of 8 increases the rate of compression by 0.19 GB/s.
Adding a ninth thread, which recruits the E cores running at only 972 MHz, increases the rate by 0.066 GB/s, which is almost the same as the compression rate achieved by one thread running at QoS 9, on the E cores alone at the same frequency of 972 MHz. When the tenth thread is added, the increment from 8 threads jumps to 0.19 GB/s, the same as is achieved by 2 threads running on the E cores at a QoS of 9 and a frequency of 2064 MHz.
Adding a thread, and effectively recruiting an additional core, is thus a linear process. For each P core added, the rate of compression is incremented by 0.19 GB/s; for the first E core, only 0.066 GB/s is added, but the second brings a change in the E core frequency, making each E core then worth 0.095 GB/s, exactly half that of a P core.
If you’ve read any of my earlier articles in which I used my test app AsmAttic to examine similar relations on synthetic performance tasks, you should recognise the form of the chart above from those results, as shown in the example below.

Looking first at the solid line, that’s a linear regression through the loop throughputs measured as billion (10^9) loops per second, against the number of processes run on P cores (in both M1 and M1 Pro chips). That has a gradient of about 0.15, indicating that each P core runs this floating point maths code at a rate of 150 million loops per second. The broken line is the equivalent regression for the four E cores in an original M1 chip, each of which runs the loop at a rate of 50 million loops per second, a third of a P core.
Between those well-fitting regression lines is one point, marked with an x, which is anomalous. That’s the result for running two processes on the two E cores in an M1 Pro, which runs at about twice the speed of two processes on the four E cores of the original M1, and very close to the speed reached by all four of that chip’s E core cluster.
Using the figures determined here for AA compression on the two core types, it’s simple to select a combination of QoS and thread number which will deliver any desired rate of compression from 0.066 GB/s for a single thread on the E cores, up to the maximum compression rate of about 1.7 GB/s using a QoS of 33 and 10 threads.
Energy efficiency
The other side of the coin is energy efficiency, most critical for the use of AA when a notebook is running on battery. I have already demonstrated how performing compression exclusively on the E cores uses 30% of the energy when running on P cores. Measurements using powermetrics during these tests show that:
- a single thread running on the E cores at a frequency of 972 MHz uses 95 mW
- two or more threads running on the E cores at a frequency of 2064 MHz uses 620 mW
- each cluster of four P cores running at a frequency of 3228 MHz uses 9,500 mW
- thus each P core running at a frequency of 3228 MHz uses 2,375 mW.
To those must be added DRAM power, which ranges from 700-1800 mW according to its rate of access.
Conclusions
- The rate of AA file compression has essentially linear behaviour on M1 chips, which can be controlled using QoS and the number of threads.
- Each thread running on P cores adds 0.19 GB/s to the overall rate of compression, up to the total number of P cores available.
- The first thread running on E cores adds 0.066 GB/s to the overall rate.
- The second thread running on E cores adds 0.124 GB/s to the first thread, making a total of 0.19 GB/s for both the E cores together.
- Each P core thread running at a frequency of 3228 MHz requires 2,375 mW, and each cluster of 4 P cores requires 9,500 mW.
- One E core thread running at a frequency of 972 MHz requires 95 mW, and both together at 2064 MHz requires 620 mW.
- Any hardware acceleration used by AA is available to each core, including E cores. It appears most likely that this is implemented in NEON rather than dedicated hardware.
Worked example
Thus to achieve a compression rate of 1 GB/s, it’s necessary for AA to have 5-6 threads running at a QoS of 33. Five threads require 5 P cores, which would require just under 12 W and compress a 10 GB file in 10 seconds.
If the same compression were performed at a QoS of 9 and with 2 threads, both running on the E cores, the rate achieved would be 0.19 GB/s, so compressing the same 10 GB file would then require 53 seconds at 620 mW.
Thus the P core option would use a total of just under 120 J for 10 GB, while the second using the E cores only would require less than 33 J for the same 10 GB file.
