
All code running in apps and elsewhere has to allocate memory to contain data. The data might be read from a file, or created by converting other data, etc., and when that allocated memory is no longer required, it has to be freed and returned for reuse. In a memory leak that return doesn’t happen, and instead of the memory being freed it’s left still in use. Over time, that accumulates, until no more memory can be allocated from that pool. At that point, the leaking app comes to a grinding halt.
There are hundreds, possibly many thousands, of different pools of memory in your Mac. They fall into two main groups: kernel and user memory. When kernel memory leaks, disaster is inevitable, as without the ability to use free memory, the kernel and its extensions simply can’t run, and a kernel panic results. User memory is allocated to each app, and in theory is almost limitless for 64-bit apps. However, a memory leak in an app also reaches a point where that app grinds to a halt. While that shouldn’t bring the whole system down, it’s still bad news.
The last major kernel memory leak occurred in the Catalina 10.15.6 update in July 2020, right at the end of its development cycle. Although kernel memory leaks are very rare in release versions of macOS, they could occur in any version, not just major updates.
User memory leaks
User or app memory leaks are far more common, and most often occur because the developer forgets to make a call to free memory when it’s no longer required. My integrity checking apps Dintch and Fintch once had a serious leak because I had misunderstood the documentation. Here’s the correct code for calculating a hash on a stream read from a file, in Swift:
theFileStream.open()

let theBufferSize = self.realBufferSize

let theBuffer = UnsafeMutablePointer<UInt8>.allocate(capacity: theBufferSize)

while theFileStream.hasBytesAvailable {

let read = theFileStream.read(theBuffer, maxLength: theBufferSize)

if read >= 0 {

let theBufferPointer = UnsafeRawBufferPointer(start: theBuffer, count: read)

hasher.update(bufferPointer: theBufferPointer) } }

theDigest = hasher.finalize()

theBuffer.deallocate()

theFileStream.close()
The penultimate call to deallocate theBuffer is crucial: without that, the memory allocated to theBuffer simply grows and grows, every time the code reads file data into theBuffer. If you watched the app’s memory in Activity Monitor, you could see that each time it read a file in, the memory used grew, but never fell again. The only way to free that allocated memory was to quit the app, which returns all the used app memory to the general pool.
Signs
The first indication that there might be a memory leak somewhere is normally a noticeable fall in performance. Actions which are normally instant result in a pause, sometimes long enough to display the spinning beachball. Kernel memory leaks may remain hidden, though, until they cause a kernel panic. The ensuing panic log may be the only clue as to what has happened.
App memory leaks in user space are easily identified using Activity Monitor or a substitute which displays accurate figures for app memory use. An app which might start up using a few hundred MB of memory grows steadily with time and usage until it reaches many GB, by which stage the app’s performance normally suffers as most of that has to be virtual. This is likely to push overall memory use into the red zone.

When the amount of physical memory is well-matched to memory demands, no swap space should be used. When there’s a significant memory leak in an app, your Mac will eventually be forced to use swap space, and that’s another tell-tale sign of a leak.
Most app memory leaks are simple programming errors on the part of those coding that app. The use of modern high-level programming languages like Objective-C and Swift has reduced these, as most memory allocation and freeing is handled automatically, so there are no calls normally required to deallocate memory. Where this becomes more complex, as shown in the example above, is when an app uses macOS frameworks. Most of the older frameworks still rely heavily on the code manually deallocating memory when it’s no longer required, and that catches developers out. The frameworks can also change, and suffer their own bugs, so there’s ample scope for everyone involved to shoulder the blame.
For the user, there’s one good way to live with app memory leaks: quitting the app should return all the memory that was allocated to it. If a leaking app has reached 20 GB of memory used, save your work, quit the app, and open it again. While this isn’t convenient, it does allow you to continue working, as does switching to another app which can do the same job. Always let the app developer know, so that they can discover the cause and fix it.
Kernel leaks
Kernel memory leaks are not only more serious, but there’s usually nothing the user can do apart from restarting the Mac. Some do arise in third-party kernel extensions, so your first action should always be to uninstall all non-essential kernel extensions, but if they’re in one of Apple’s, or the kernel itself, all you can do is wait for Apple to fix it, once you’ve reported the problem with a panic log.
Most kernel memory leaks occur in special pools of memory reserved for ready use by the kernel and its extensions, known as Mach zones. When a user process wants some memory, it asks to be allocated some by the kernel using a call such as malloc(); when a kernel extension wants some memory allocated to it, it uses a different call such as zalloc() or kalloc(), which isn’t available to user processes, so that the memory is allocated from that reserved for kernel mode processes. These are similar to what are known as memory caches in Linux, or Pools in Windows.
Mach zones aren’t normally open to inspection by the user, except with the
sudo zprint
command, which provides a long list of each of the Mach zones in use and figures for their usage. These have changed considerably since the days of Catalina, making it very hard for even advanced users to see the wood for all these trees.
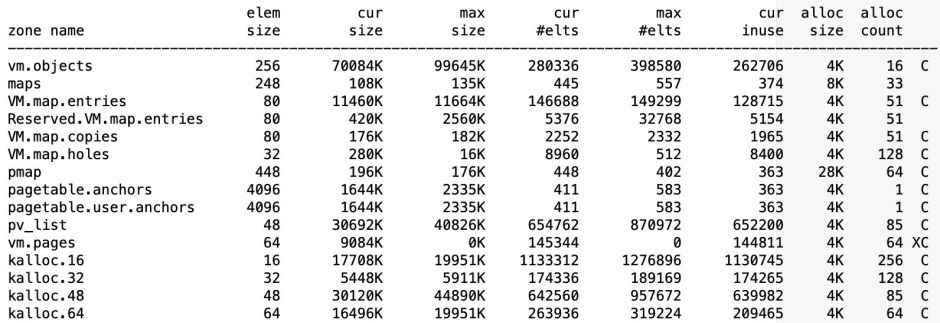
This is just the start of a long list of all the zones, giving the size of the memory blocks it contains, its current total size and the maximum, the current number of elements and the maximum, and more.
Over time, even a small kernel memory leak can progressively consume all the elements currently allocated within one or more of these zones. This is detected as the zone size in use approaches its maximum, the high water mark. Some zones are expandable, and macOS can then allocate additional memory from a dedicated zone_map area to expand that zone. Rarely, such additional memory can be obtained from memory outside the zone_map, but in most cases that’s not possible, and the eventual result is zone_map_exhaustion – zone memory has run out, even though some zones still have memory available. Thus, a memory leak in a kernel extension can run the kernel out of zone memory, something you may well not notice in Activity Monitor, which is more concerned with the management of user memory.
