
If you’ve read the excellent performance analyses already published by AnandTech and others, by now you’re probably thinking that the CPU cores in the M1 Pro and Max are among the less innovative parts of the M1 Pro and Max SoCs. I hope in this article to show you how they’re managed quite differently from those in the original M1, and how that might affect what you can do with these latest models.
On paper, the major difference between the M1 and M1 Pro/Max CPUs is core count: the original M1 has a total of eight, half of which are E (Efficiency, Icestorm) and half P (Performance, Firestorm) cores. The M1 Pro and Max have two more cores in total, but redistribute their type to give eight P cores and only 2 E cores. It would be easy to conclude that experience with the first design showed that the E cores were only lightly loaded, so fewer were needed, but delivering better performance to the user merited twice the number of P cores. While that may well be true, you also have to look at how the cores are actually used.
As I’ve already described, in the M1 tasks like background services with a low QoS are run exclusively on its E cores, while those at any of the three higher levels of QoS are scheduled to use both P and E cores. As with symmetric multiprocessing CPUs, load on different cores is otherwise fairly well-balanced.
To illustrate this balance, here’s a heavy load placed on the eight cores of an Intel Xeon W CPU in my iMac Pro:
All eight real cores on the left are fairly evenly loaded; the eight cores on the right are virtual, and realised by hyperthreading, which wasn’t required here.
Here are the four E and four P cores under load from a high QoS task in the M1 SoC in my M1 Mac mini.
Again, load is normally spread fairly evenly.
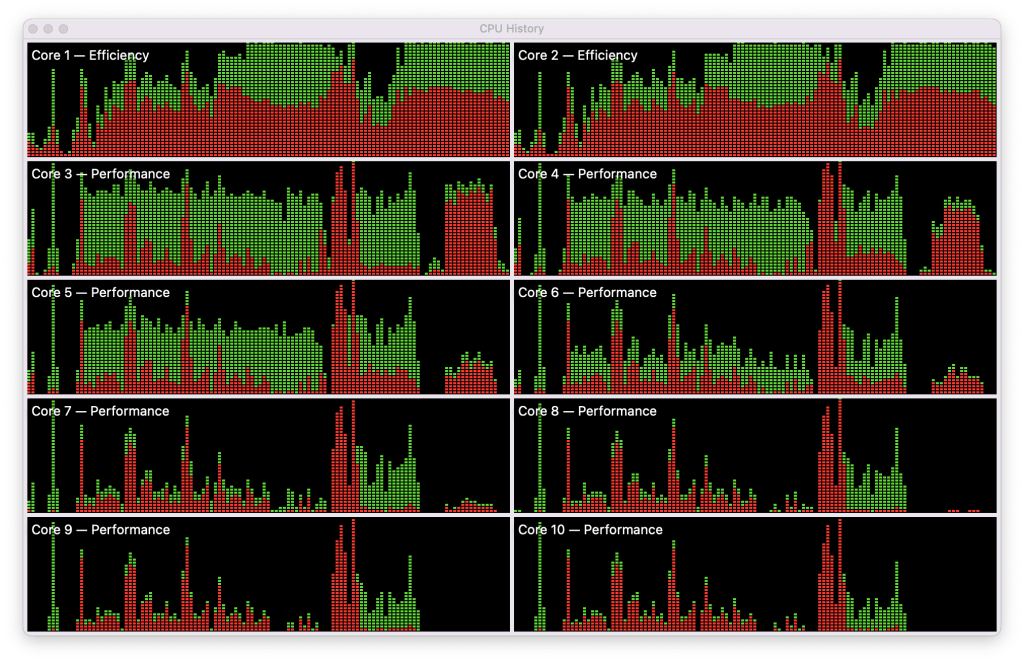
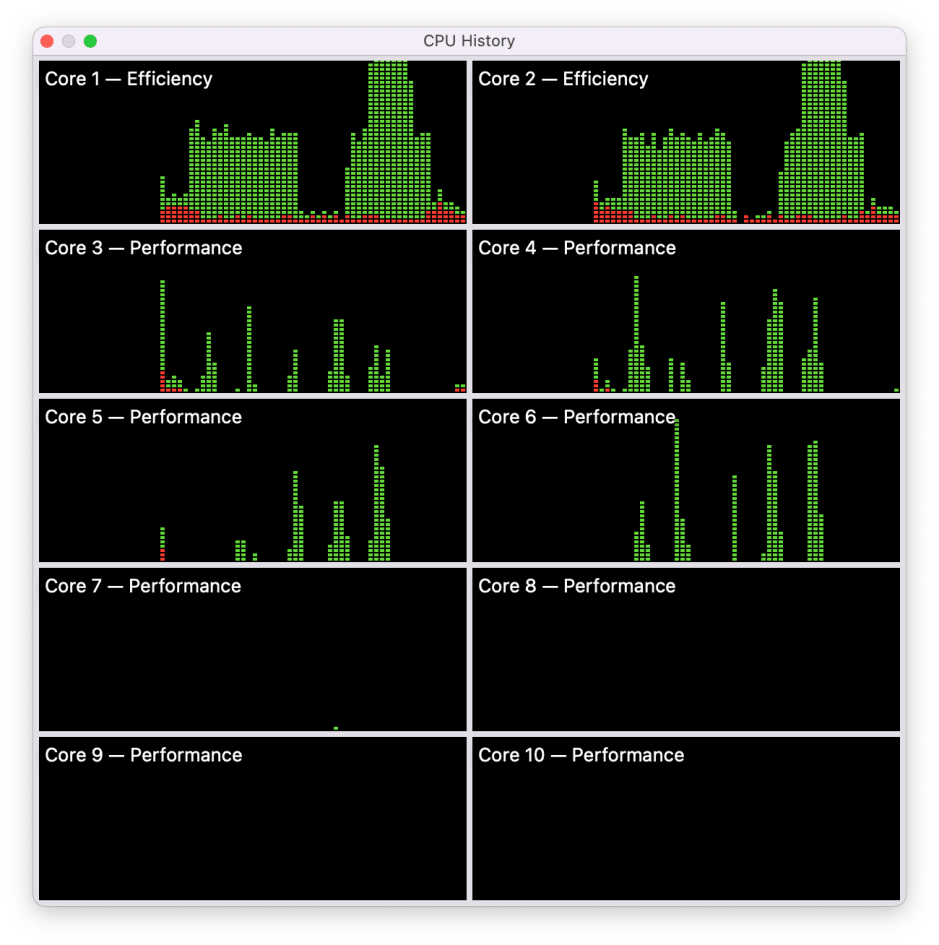
Here’s the equivalent, a hefty compression task using the AppleArchive library, running on an M1 Pro. As in the above charts, the red bars represent the System load, and those in green are from the User. I’ll refer to cores by their number and type, so that core 2E is the second E core, and 5P is core 5, a P core.
Load on the two E cores is evenly balanced, for both User and System, but there are consistent differences in load on the P cores. The first four (3P to 6P) are more heavily loaded throughout, although the System (red) load is more even across all eight P cores. Even within the first four P cores there are differences in User load: 3P bears a heavier load than 6P, for instance.
This isn’t always the case, though.

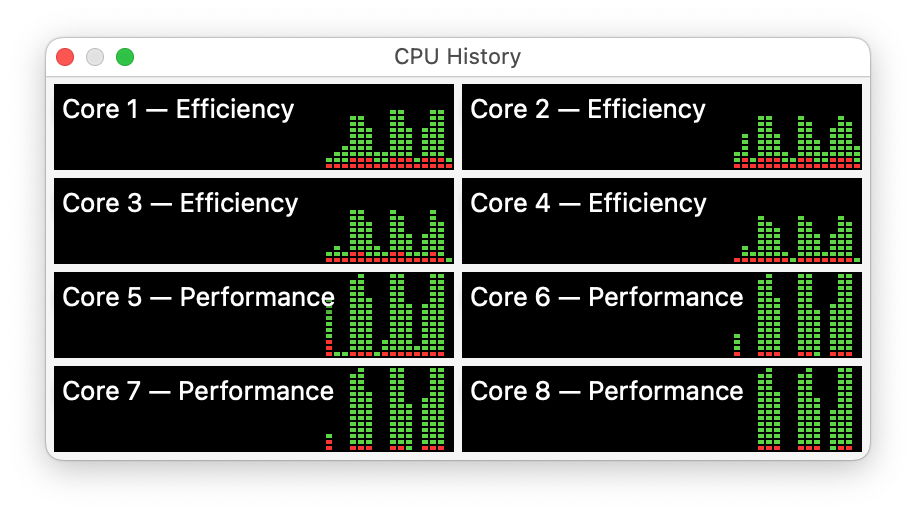
When running the Geekbench 5 CPU benchmarks, early tests are still confined to the first four P cores, but their later tests are more evenly distributed across all ten cores. Surprisingly, these benchmarks seldom exceed 50% load on any of the ten cores, which raises the question of how accurately they represent maximum CPU performance.
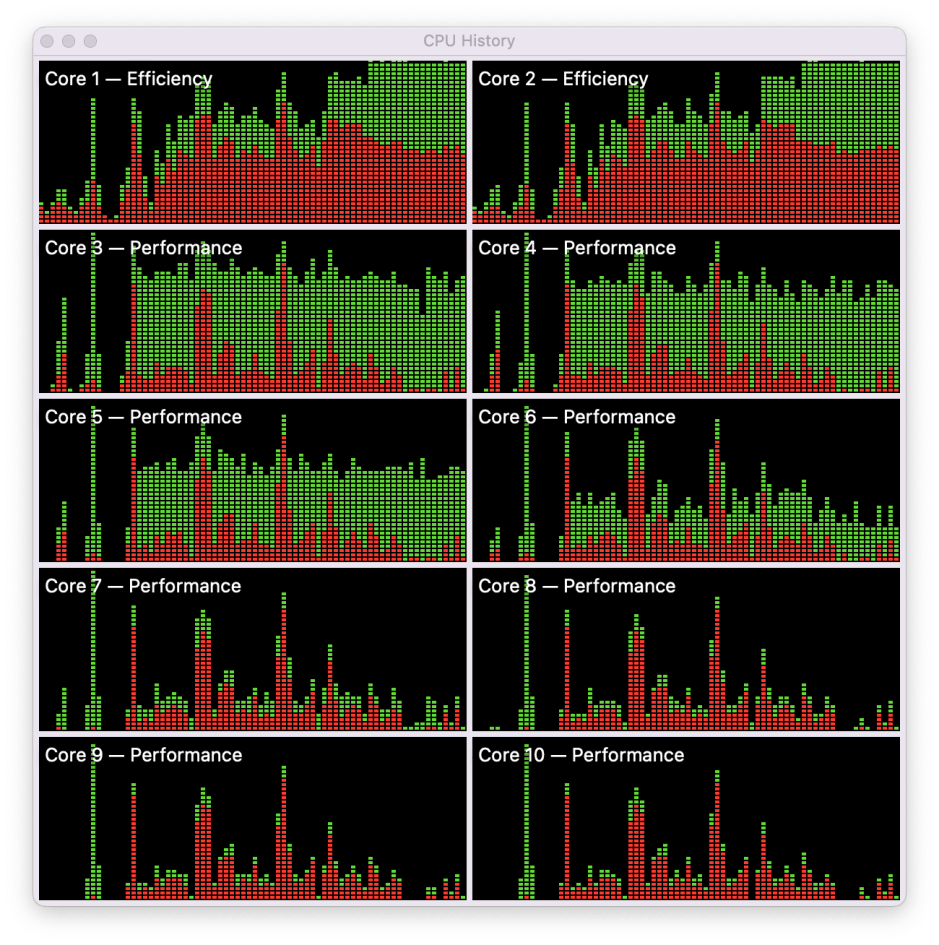
Here’s a more obvious example, again using AppleArchive on hefty tasks.

These load the E cores to 100%, with a high proportion of that being System. On the P cores, while the System load is fairly evenly spread, the User load is highest in the first four P cores, and least in the second group. Even within those two groups, the lowest number core (3P and 7P) bears the heaviest User load, and the highest number core (6P and 10P) bears the lowest.
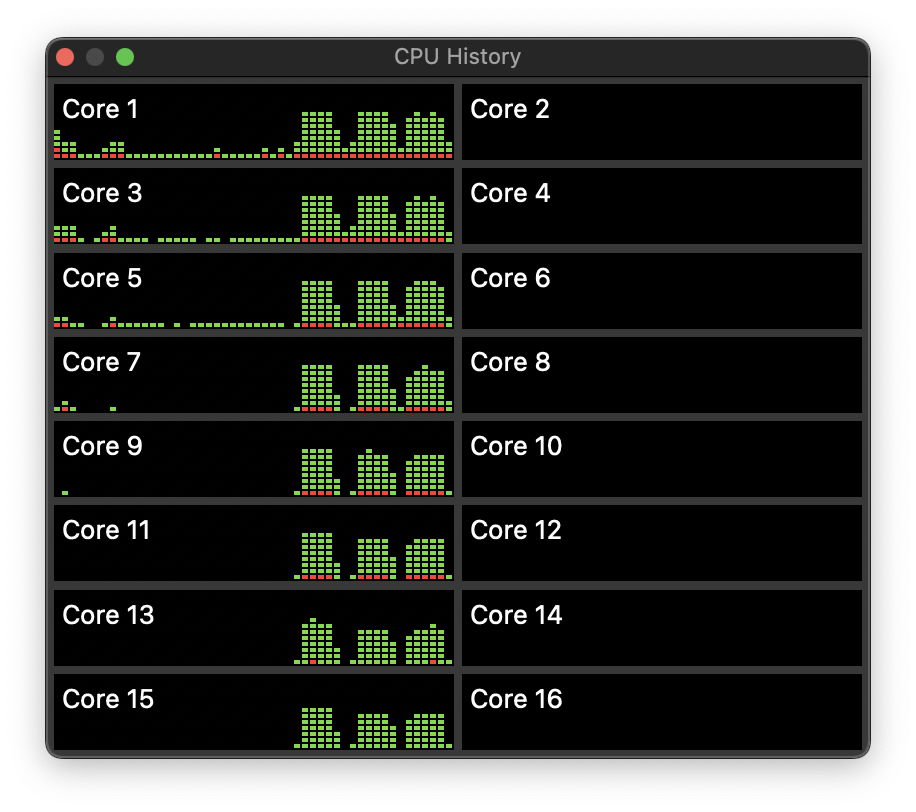
My app AsmAttic gives precise control over the distribution of numeric benchmark tasks on ARM processors. I therefore turned to that to look in more detail at these unusual patterns of core use.
This image shows a series of benchmarks being run using two different QoS levels. The two E cores were loaded with one slow task first, then two slow tasks, which brought them to full load. Over the same period, a succession of shorter tasks at high QoS levels were run on the P cores. These were only loaded on the first group of four P cores, and during this whole period the second group of P cores were almost completely unloaded.
For this series of tests, AsmAttic had been configured to use a maximum of four concurrent processes. When that is changed to eight, which could have been loaded onto all eight P cores, its tests remain constrained to the first group of four P cores.
Performance differs little on the P cores of the M1 Pro and the original M1. For example, the same hand-coded assembly language for floating point dot product calculation using the ARM Neon vector unit took 0.126 seconds on the M1 Pro (mains power) and 0.142 seconds on the M1. The M1 Pro time is just under 90% that of the M1.
Differences in performance were much greater on the E cores, where they also varied according to whether the MBP was running on battery alone:
- M1 0.409 s (100%)
- M1 Pro on battery 0.340 s (83%)
- M1 Pro on mains 0.169 s (41%)
Those results are for a comparable benchmark using Apple’s Accelerate library dot product function.
Taken together, these results show that process allocation to cores in the M1 Pro and Max is carefully managed according to QoS (as in the M1) and between the two groups of P cores. This management aims to keep the second group of P cores unloaded as much as possible, and within each group of P cores loads lower-numbered cores more than higher-numbered. This is very different from the even-balancing seen in symmetric cores, and in the M1.
The end result is that the two E cores in the M1 Pro/Max are significantly faster (in some respects, at least) than the four E cores in the M1, although the E (but not the P) cores are slowed when running on battery alone.
Because of this sophisticated asymmetric core management, measuring CPU performance in the M1 Pro/Max is more complex than when cores are managed symmetrically. While running on battery alone shouldn’t impair the performance of CPU-bound tasks run at higher QoS, you should expect background services run on the E cores alone to take longer.
There are also interesting implications for developers wishing to optimise performance on multiple cores. With the advent of eight P cores in the M1 Pro/Max, it’s tempting to increase the maximum number of processes which can be used outside of an app’s main process. While this may still lead to improved performance on Intel Macs with more than four cores, the core management of these new chips may limit processes to the first block of four cores. Careful testing is required, both under low overall CPU load and when other processes are already loading that first block. Interpreting the results may be tricky.
I suspect that Apple has done this to further improve energy efficiency and ensure good responsiveness to new CPU-intensive tasks.
I eagerly look forward to seeing more detailed information explaining how the E cores in the M1 Pro/Max appear to outperform those in the M1.
