

At last, I am back to wrestling with the problems of measuring the performance of SSDs, and of storage more generally. In this article, I show and explain my latest measurements on the internal SSDs of M1 Macs, to be more precise an M1 Mac mini and a MacBook Pro.
The story so far
It all started with the discovery that generally available tools which claim to measure the performance of disks in Macs leave a lot to be desired. When we wanted answers to simple questions such as whether the internal storage of M1 Macs was quicker in use than that in recent modes with a T2 chip, came the answer well, maybe, or maybe not.
I decided early on that what was needed was a different tool. The approach I took was illustrated by the dragster driver, who might tune his engine against benchtests of raw horsepower, but puts most store by road-testing. All Mac users will be comforted and impressed when a low-level benchtest which isn’t even run within macOS shows their SSD is blisteringly quick. But what we actually need to know is whether that translates into noticeable improvements in the apps we use every day. A good illustration of this is in last week’s short look at the effects of thermal throttling in an expensive, high-performance SSD. Its benchtest results are far superior to most other SSDs, but when you work it hard, write speeds drop to little better than more affordable models.
The penalty of using similar code in testing as an app might use, is that it’s also subject to many vagaries, such as the effects of caching. It was probably that which made existing tests unreliable, and return results which aren’t physically possible at times. So one of the major bear-traps I had to avoid was measuring the performance of caching to memory.
After considerable experimentation in code, I arrived at tests which, when carried out with a bit of care, appear to return results which above all make sense, and appear acceptably consistent across different Macs and situations. They can never be as reproducible as low-level benchtests, but that’s a consequence of the choice of a road-test approach.
Outliers
Other performance tests deliver simple, clear and graphical results which hide a multitude of sins, most notably in their handling and analysis of their measurements. To put it bluntly, they lie.
You don’t have to run many performance benchmarks on storage to realise that, unless they’re very low level, significant numbers of measurements are outliers. The great majority of the measurements you make might come back with a write speed of around 2 GB/s, then every so often you’ll get one which is as low as 300 MB/s, or as high as 3 GB/s. Unless you shut the whole of the rest of macOS down, that happens, but seldom appears in the pretty bar charts the apps show you. That’s because they censor their data.
How benchmarking apps handle outliers is crucial to how much you believe them. As far as I can tell, most take the easy way out and average, smooth, or exclude the noisy results they obtain. I won’t bore you with the statistical arguments, suffice it to say that you simply can’t do that, not without making your results completely untrustworthy.
I’m still on something of a protracted journey to get the very best analysis for my benchmarking, although what I use at present is quite close, and may prove to be the best practical solution. See how you think it handles the results in this article.
Testing
To gain more insight into the efficacy and reliability of the tests now available in my free app Stibium, I’ve been running some really large tests on my two M1 Macs. These first write 400 test files, ranging in standard sizes from 2 MB to 2 GB, in a randomised order. Before reading those, I restart the Mac.
Stibium is unusual as it estimates overall read and write rates by measuring the slope of a graph of the time taken to read/write a file (Y) against its size (X). I show those graphs for my M1 MacBook Pro first, with reads shown before writes.
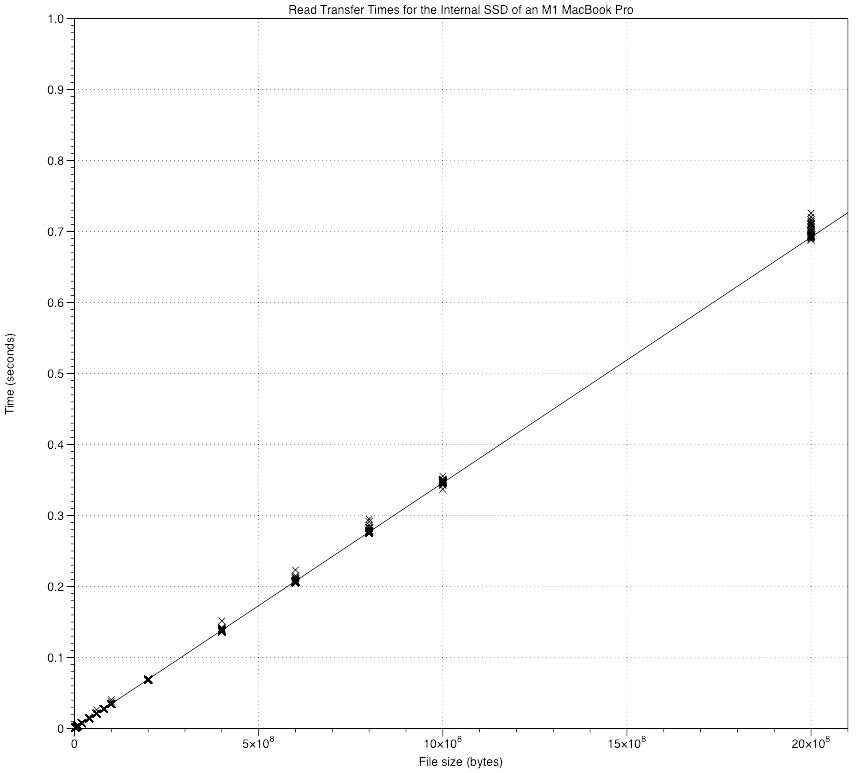
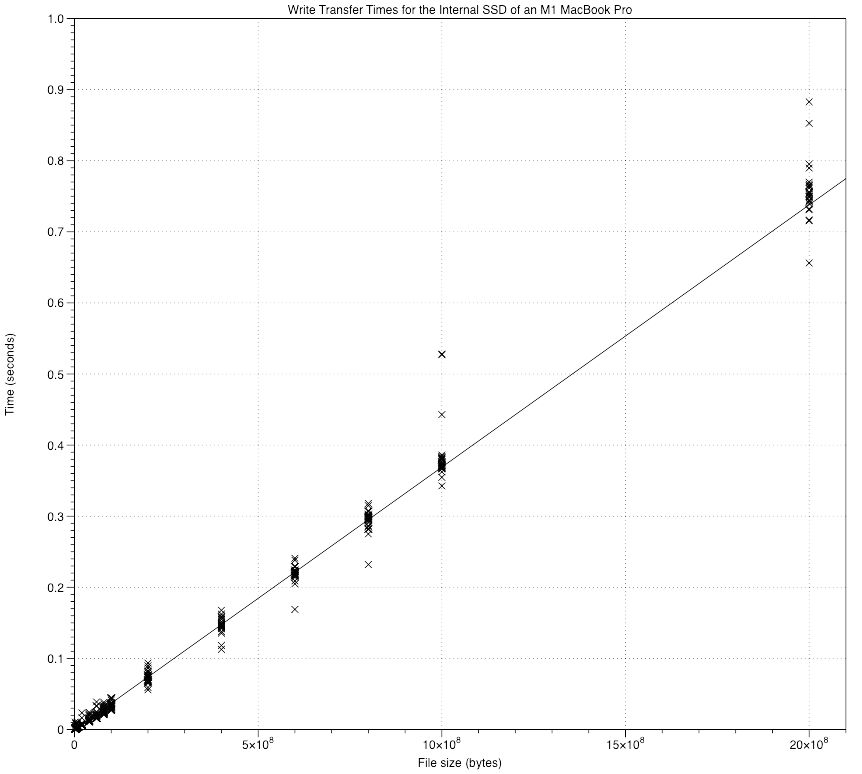
The regression lines shown are calculated using the Theil-Sen method, which unlike standard least-squares linear regression is tolerant of outliers. For each of the file sizes, there are 25 measurements, with relatively few outliers. Fit of the lines appears good by any standards, and there are no points far below the line which might indicate that the transfer occurred to cache rather than the SSD itself.
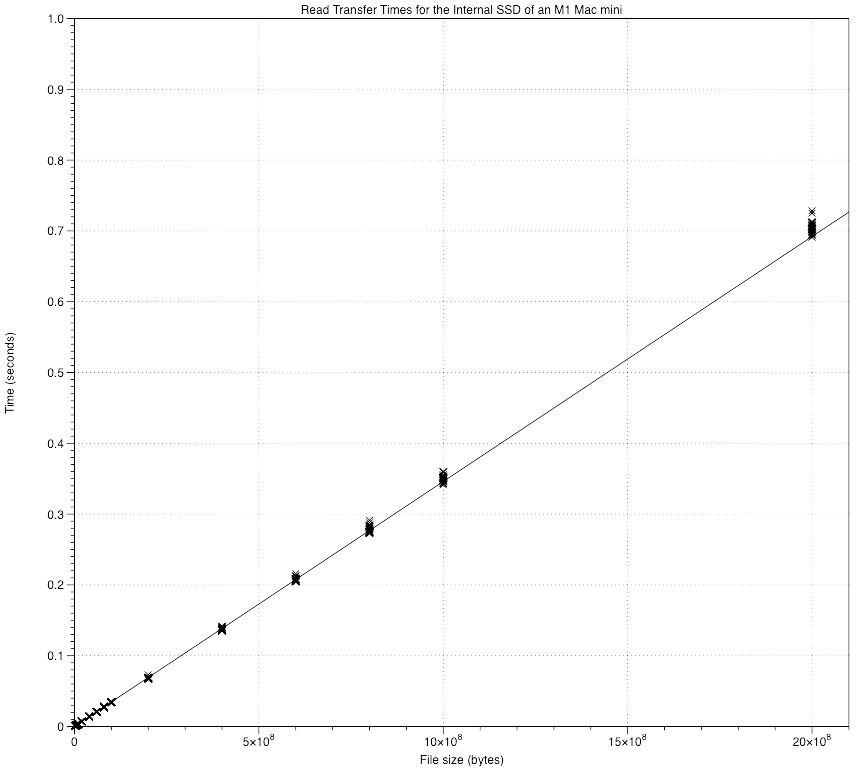
The M1 Mac mini isn’t quite as clean, particularly when writing.
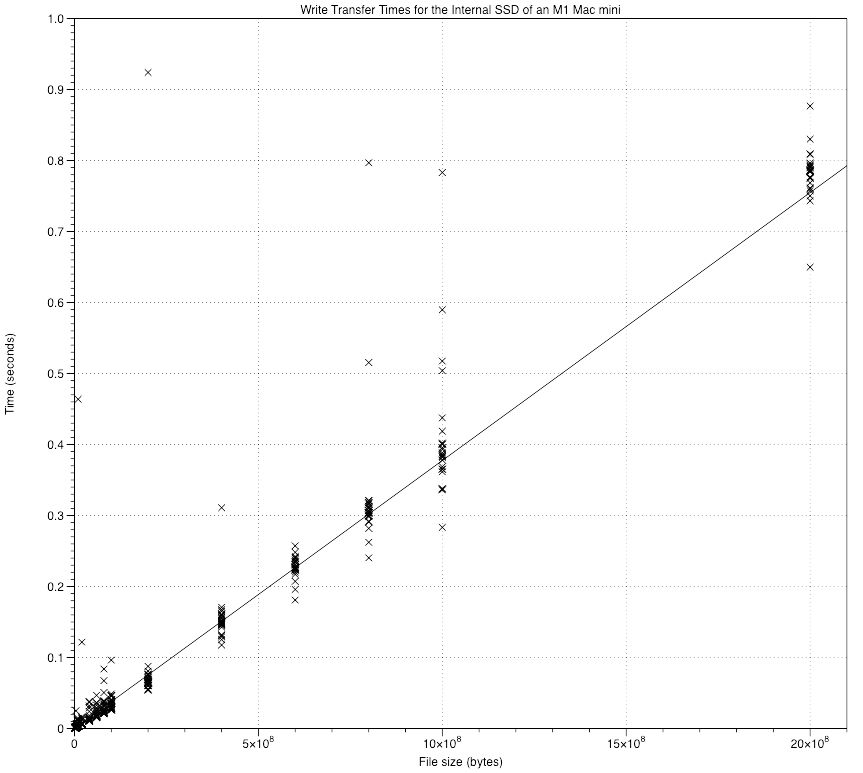
The second of those, for writing, actually omits an outlier for the largest file size of 2 GB which took over 3 seconds to write. You can imagine how that draws a least-squares regression line away from the tight clusters of points.
Although these results for the M1 Mac mini don’t show the same pattern as in thermal throttling, outliers are more common, and are further away from the regression line. There are two ways to investigate this further, which I show first for the better-behaved MacBook Pro, then for the mini.
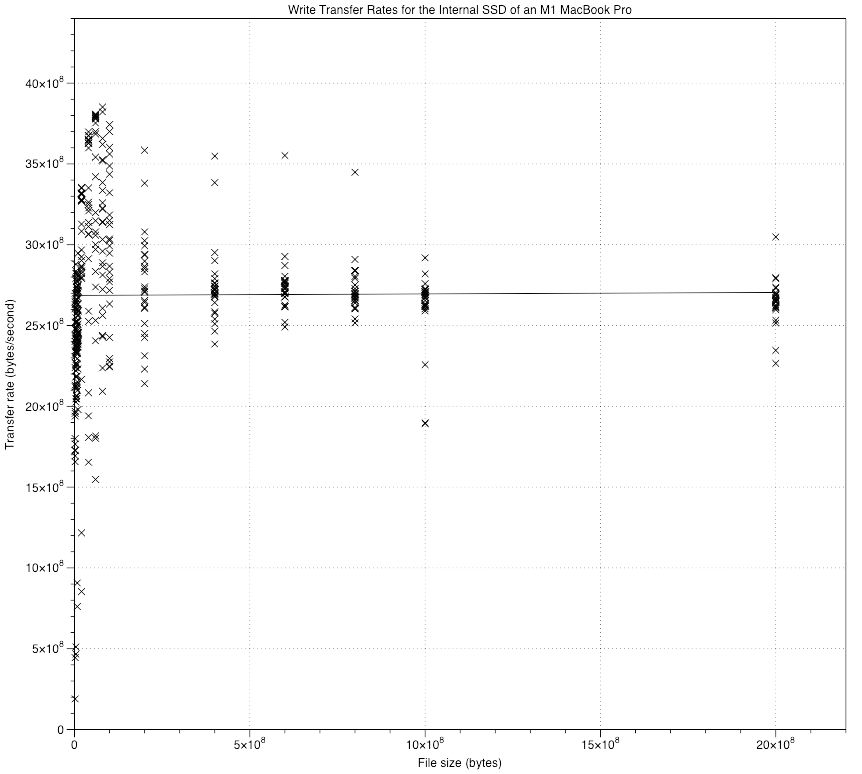
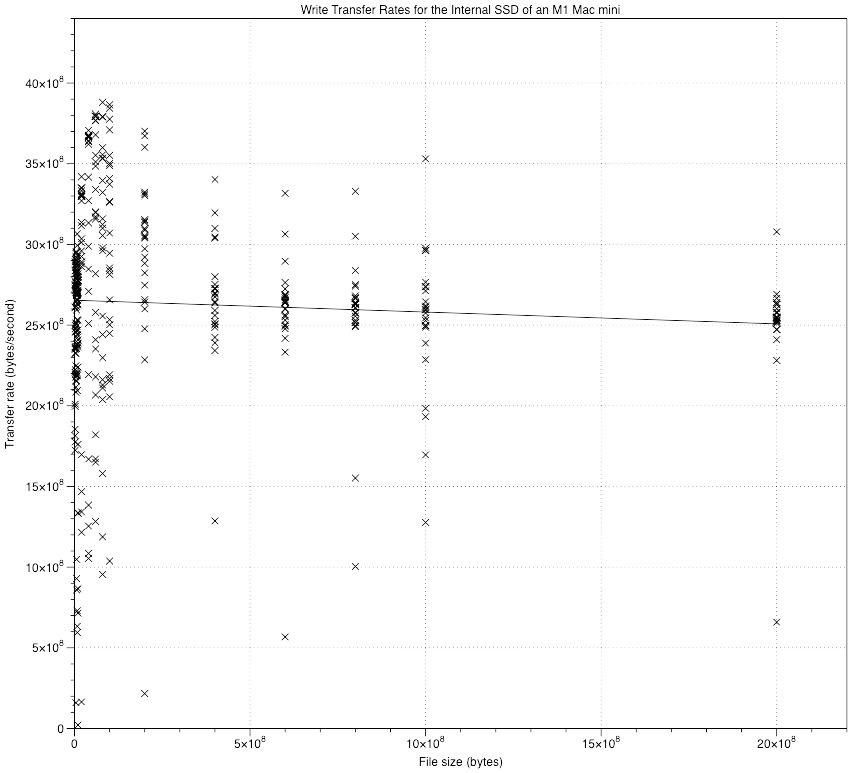
These show write speeds (Y) against file size (X). In the range of file sizes used, from extensive previous tests, these should form flat lines, parallel with the X axis. Those for the MacBook Pro do, after some increased scatter at low file sizes. In addition to increased scatter, the line for the mini is falling slowly with increasing file size.
The other diagnostic chart which I use here shows measured write speed for each file size according to the elapsed time of the whole test. Because file sizes are written in random order, this shows the most scatter, but gives a good idea of whether overall performance has fallen off during a test.
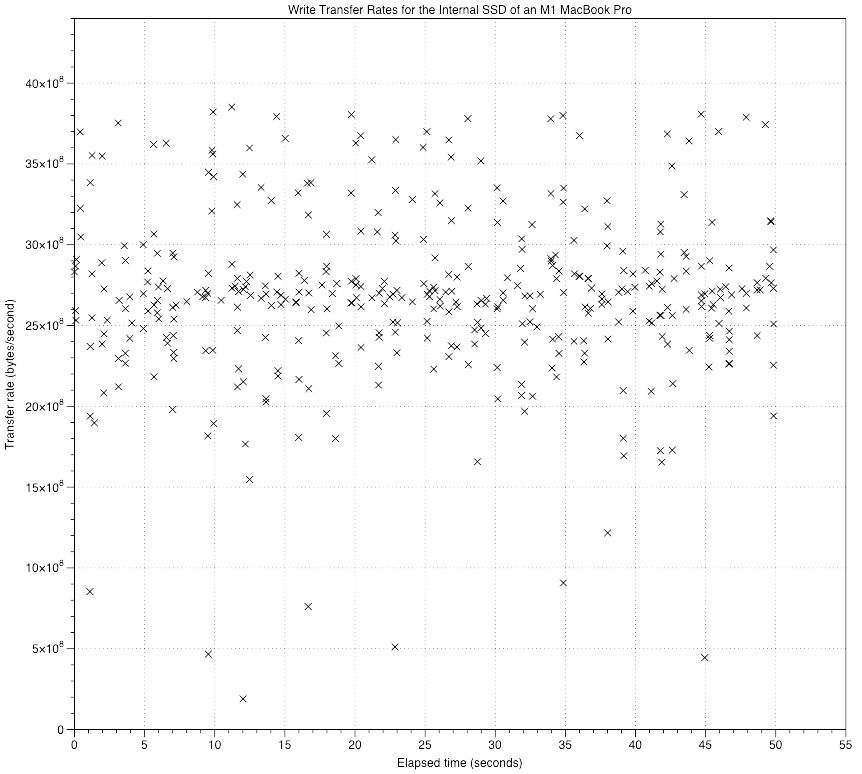
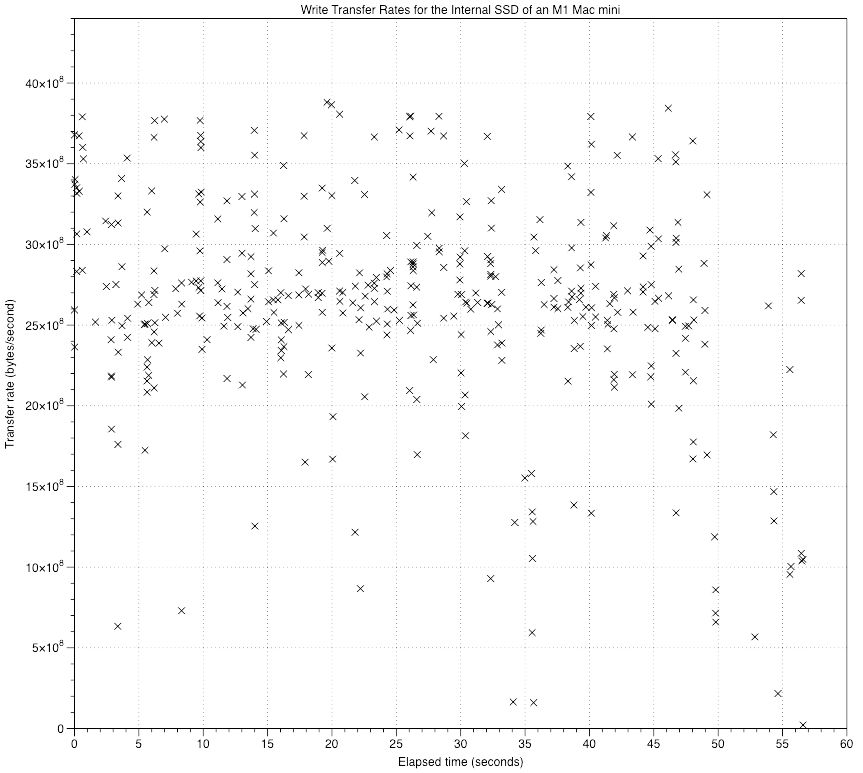
Little changes over time in the MacBook Pro results, but after about 48 seconds of total write time, the performance of the mini does appear to fall off, although it doesn’t appear as clear-cut as I saw in thermal throttling.
At this stage, although I can’t rule out thermal throttling, that appears very unlikely in a Mac which has effective active cooling. Instead, I suspect what might have happened is that macOS brought forward the next Time Machine backup because of the large quantity of files which had been written – at the time that performance fell, that would have been well over 100 GB. Despite that, overall results are quite good enough to estimate write speed for that test.
So, after the longest preamble you could want, how did the two M1 Macs perform?
The M1 MacBook Pro read at an overall rate of 2.9 GB/s and wrote at 2.7 GB/s. The M1 Mac mini also read at 2.9 GB/s and wrote at 2.7 GB/s. Those were measured over 400 files containing over 130 GB of data in less than 50 seconds. That seems pretty quick to me, and not that different to earlier estimates made using older versions of Stibium.
This has been very useful experience, and is focussing my mind on the graphical support which Stibium needs. Displaying standard results by file size in a gaudy bar chart doesn’t help, as you’ll see from the graphs above. What is more important is to be able to show estimated transfer speeds against time during testing, and outliers from the regression line used to calculate overall transfer speed.
As ever, your ideas and comments are more than welcome.
