
A week ago, I published charts here which showed that, far from levelling off, fresh cases of Covid-19 in England were continuing to rise non-linearly. At the time, when daily figures had reached 10,000 on 1 October, I estimated that they were doubling every 9 days. That would mean that they would have reached 20,000 per day on 10 October, and 40,000 on 19 October. So what has happened since?
Although there has been intermittent speculation that numbers have been levelling off, that has been based largely on 7-day moving averages of fresh cases by the date of report. As I have pointed out repeatedly, using the date of report rather than that on which the specimen was taken isn’t a good choice. Furthermore, 7-day moving averages may be fine for economic data, but further distort these rapidly changing figures.
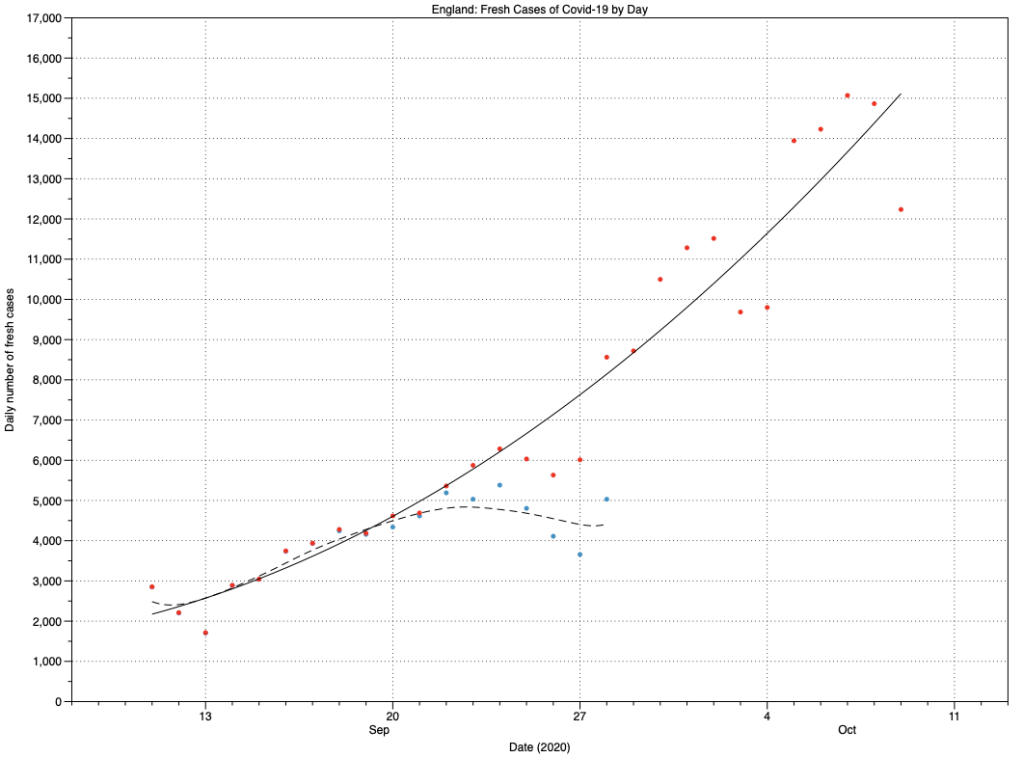
Looking at raw daily numbers of fresh cases by the date the specimens were taken, there is little sign of significant easing in the rate of growth. Indeed, daily numbers continue to grow more rapidly each day. The good news is that the curve, fitted here by a quadratic function, isn’t steepening quite as rapidly as it was at the start of the month.
The points in blue, and dashed curve, represent those which had been given erroneously prior to 2 October, when several news stories proclaimed that those figures were evidence of the second wave levelling off. Since then, daily figures have risen from around 5,000 to 15,000 – trebling in just over two weeks. My latest estimate of growth, though, is that it has taken 12 days for them to grow from 7,500 to 15,000: that’s doubling over two 6-day infection cycles, an R number of around 1.5, which is a small improvement.
The projection from this fitted curve would therefore be:
- 30,000 fresh cases on 21 October,
- 60,000 on 2 November,
- 120,000 on 14 November.
Although not as horrific as my previous extrapolation, unless the R number is brought down much closer to 1.0 very soon, it’s hard to see how further substantial rise can be avoided. After all, over the great majority of England the only real changes in control measures since I first reported on the second wave on 22 September have been to relax the rules. By a strange coincidence, we have now learned that on the previous day, 21 September, the government’s scientific advisory committee SAGE concluded that immediate and effective measures were required to control infection rates.
More than three weeks later, the UK government has still failed to take effective action on the recommendations of its own expert advisors.
