
Last week, someone tweeted a chart showing the daily numbers of fresh cases of Covid-19 being reported in Florida, stating that they are growing exponentially. If that’s true, it’s extremely worrying and – for this pandemic at least – relatively unusual. As I showed previously, careful examination of the data generally reveals linear rates of growth, for whatever reasons. Armed with my trusty macOS charting apps DataGraph and Igor Pro, I set off to test whether this is true.
Unfortunately, I’ve been unable to locate high quality data for the three US states which I chose to examine – figures reporting the numbers of Covid-19 cases diagnosed on the day that their swab was taken. Instead, I have had to make do with numbers of positive tests on each day between 13 June and 3 July, when increases have become most evident.
Data for Florida residents are taken from those published by the Florida Department of Health, for Texas from the Texas Center for Health Statistics, for California from the California Government, and I have taken figures for the ‘megacity’ of São Paulo, Brazil, from those compiled and published by Wesley Cota and colleagues.
The State of Florida has a population of over 21 million, and throughout the year is subtropically warm and humid. The State of Texas has a population of about 29 million, and its climate in the summer tends to be hot and rather drier. The State of California has a population of about 40 million, and has a wider range of climates, with much of it being similar to the Mediterranean. São Paulo is the most populous city in Brazil and the whole Americas, with a population of more than 33 million. Being in the southern hemisphere, it’s currently in mid-winter, with generally cloudy weather and cool to moderate temperatures.
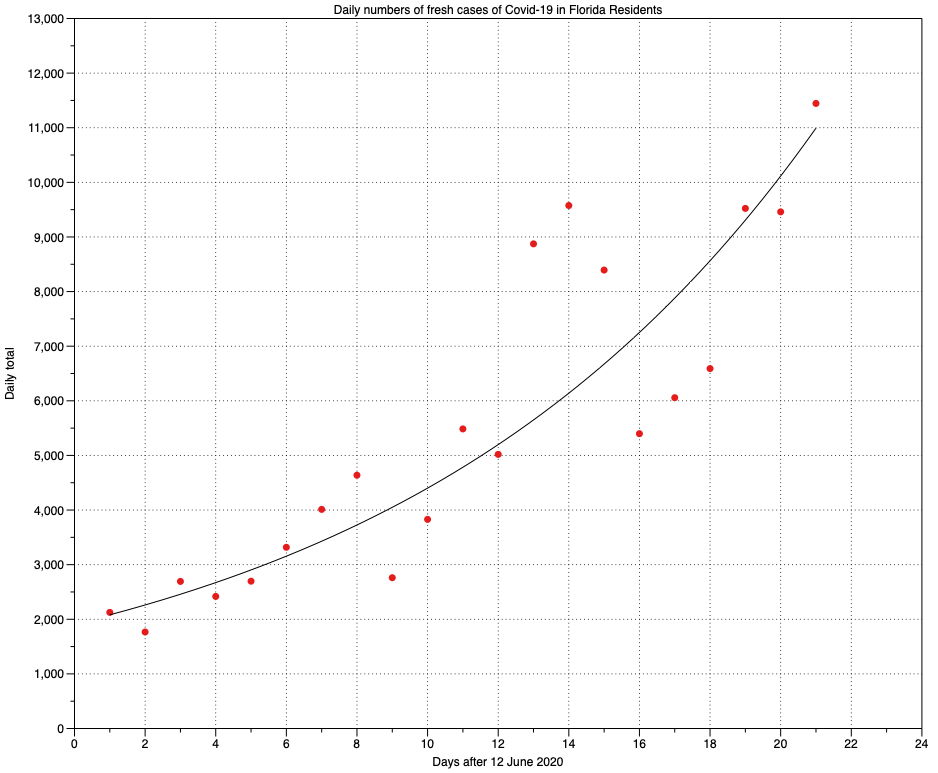
Looking at Florida first, the best fit to its noisy data is an exponential curve, which can be straightened using the logarithmic plot as shown below.
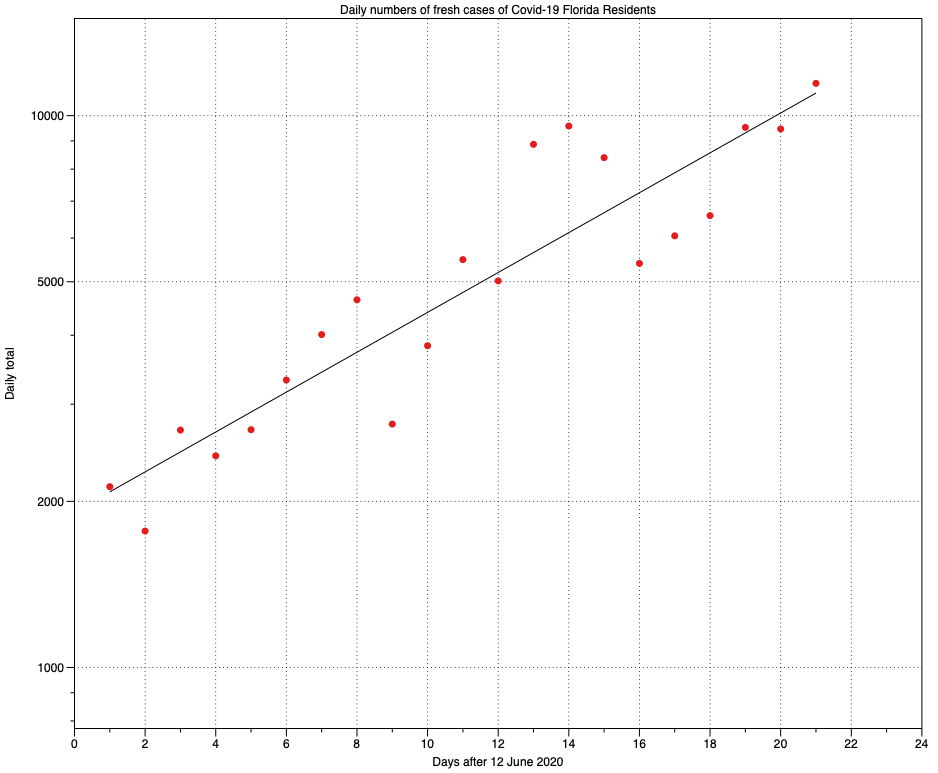
The line of best fit is for the equation y = 1914.9 * e^(0.083217 * x). This gives an estimate of the effective Rt of around 3.5, which is similar to those currently proposed for Covid-19 being spread freely in large susceptible populations, its R₀.
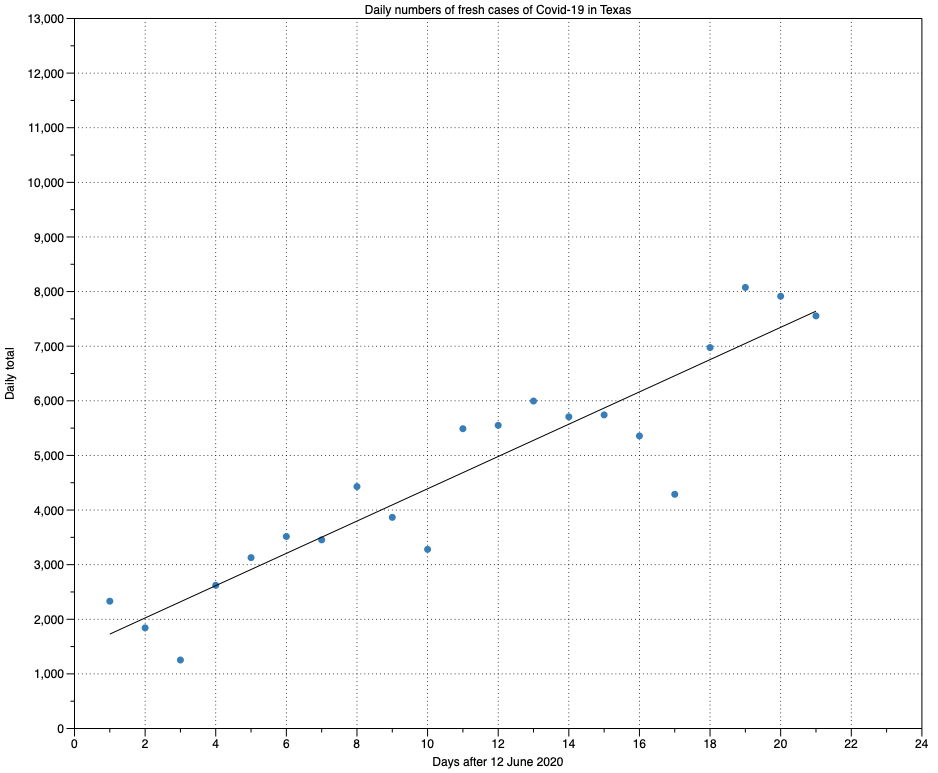
Data for Texas are best fitted by a straight line with the equation y = 1433 + 295.59 * x, which has a Standard Error on its gradient of 28.253. This means that, on average, fresh case numbers are increasing by about 300 cases per day per day.
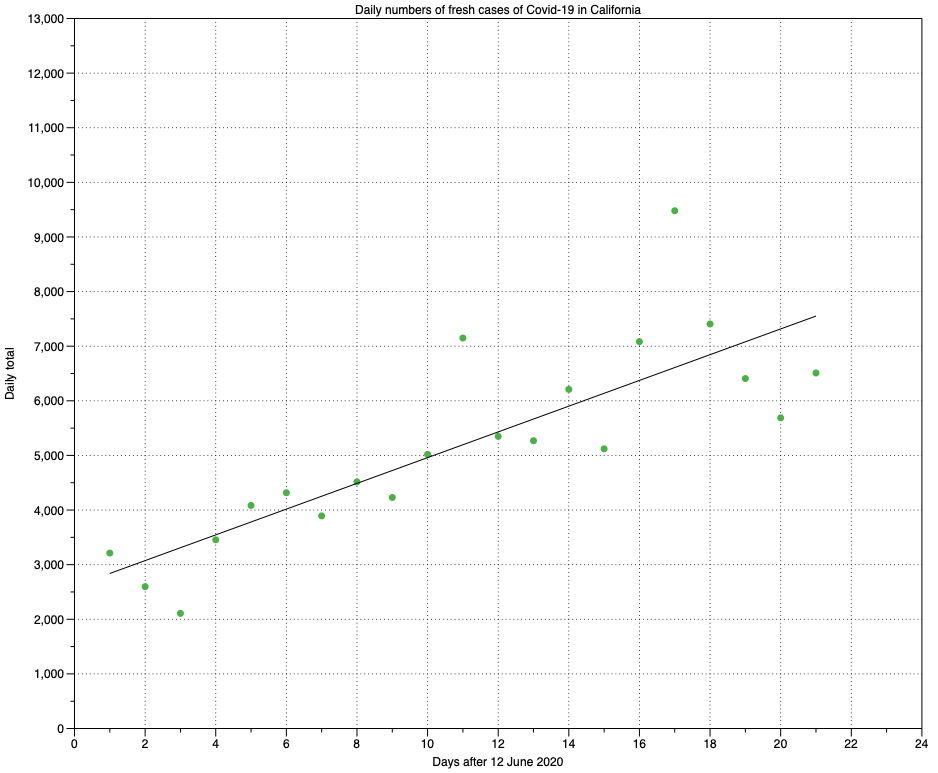
California’s figures are best fitted by a similar straight line with the equation y = 2602.9 + 235.67 * x and a Standard Error on the gradient of 37.652. Fresh case numbers are here increasing more slowly than those of Texas, at around 235 cases per day per day.
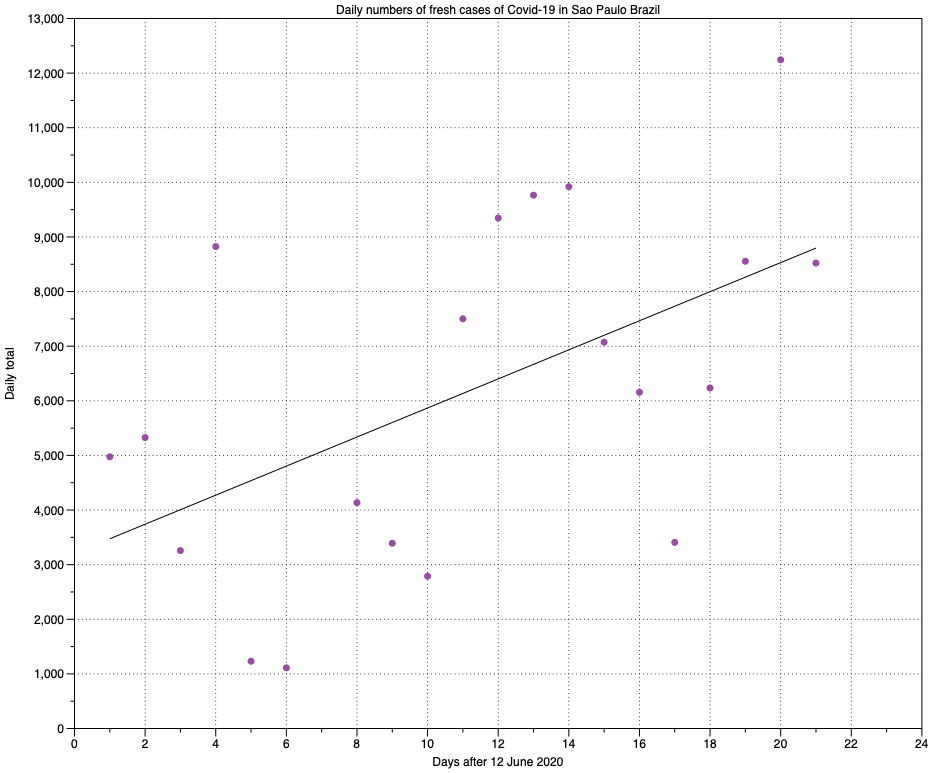
Data for São Paulo are extremely noisy, and fitting any line to them results in high residuals. The best fit straight line has the equation y = 3207.8 + 266.15 * x, with the Standard Error of the gradient at 99.05. I could only do this after removing one outlying data point which was 10,000 higher than the next highest, which isn’t shown on this chart, being almost 20,000. This suggests that the rate of growth of fresh cases in this huge city is around 270 per day per day.
The answer to my original question is that yes, between 13 June and 3 July, fresh cases of Covid-19 in the State of Florida grew at an exponential rate, at approximately that of its proposed R₀. This is consistent with unconstrained transmission in a fully susceptible population, and is extremely alarming. Even if strict lockdown measures were to be enforced across the state immediately, it looks as if Florida will suffer far more cases than anywhere of comparable population in the USA.
The best hope for Florida is that this curve proves to be the foot of a sigmoid curve, and will soon settle to a linear rate of growth. Even then, cumulative totals are going to be extremely high until the curve might flatten off to a peak. It’s essentially impossible to predict when any of those might happen, but experience in England and New York City suggests that peak rates are unlikely before mid-July. This is likely to be a very difficult month for Floridians.
Although growth in numbers in Texas and California currently appears linear rather than exponential, without effective measures to slow the spread of Covid-19 their numbers will keep rising alarmingly. These are summarised neatly by superimposing the fitted lines for each of the four areas.
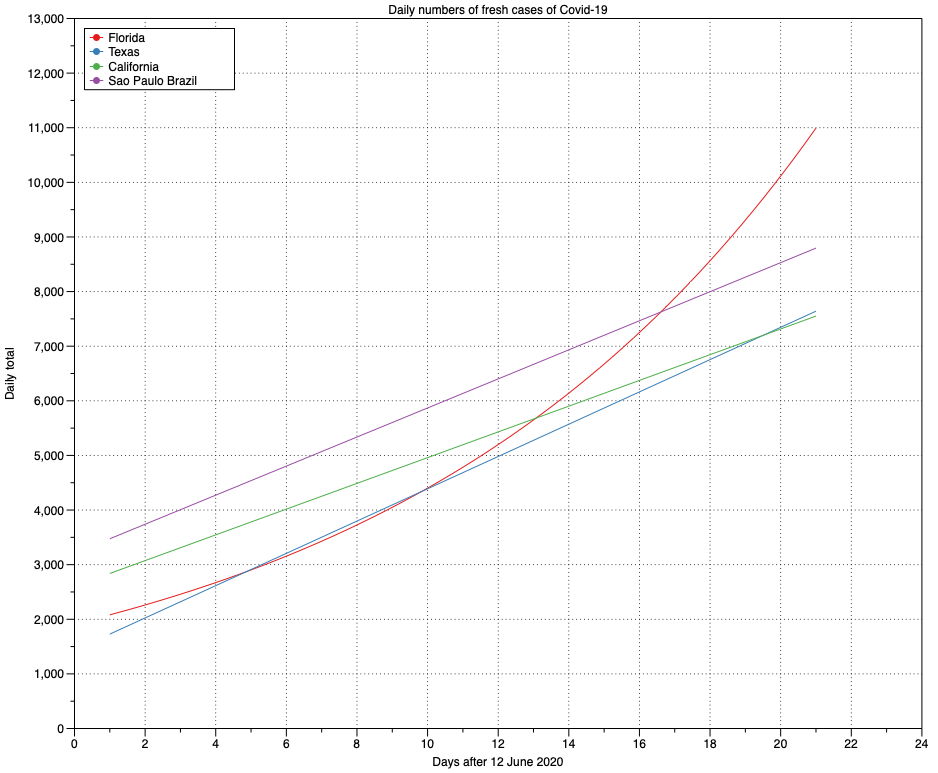
At present, these rates of rise are around a tenth of those seen during the greatest rise in infections in England (3,450 cases per day per day), and about 6% of the maximum in New York City (5,083 cases per day per day).
Some have been surprised that these relatively warm states are experiencing rising infection rates during the warmest months of the year. Early in the pandemic, a pre-print was published which looked at rates of infection in a range of countries with different climates. The evidence then suggested that cases were relatively uncommon in countries with a minimum temperature of around 17˚C and high humidity. Many of the countries included in tht study have gone on to have large numbers of cases since then, and the relationship with climate was weak at best.
Influenza also influences our thinking. Because influenza is a largely seasonal problem, it’s easy to assume that this coronavirus will behave likewise, as it also affects the respiratory tract. Evidence here from Florida is that Covid-19 still transmits freely irrespective of the climate. This is borne out by the spread of the 1918 pandemic influenza through warm European countries during summer.
What appears to be far more important in each of the four areas examined here are their lax measures in place to limit spread of infection from late May onwards. Covid-19 isn’t a forgiving disease, and thrives on human weakness and failings.
