
Even before Apple introduced the unified log in Sierra, OS X logs were becoming crowded places. If you’re going to access the unified log, knowing how to find your way around it is critical. It’s so easy to get lost in tens of thousands of messages, with hours passing by. This article provides practical guidance for those using my free log browser Ulbow; much of it also applies to Consolation, with its rather different interface. If you’re trying to use Console, or the log command, then I’m afraid that most of these features aren’t available to you.
The most important information which you need to find your way around the log is knowing the period of interest, and having some navigational landmarks on which you can rely.
The period of interest is essential. If you don’t know when something happened, your first task is to find out. For example, if you think that your Mac restarted at some time in the last 12 hours, your first step is to search the log for one of the landmarks which will identify the startup. Once you’ve located that, you can hone in to find out more detail.
There are two main categories of tools which will locate landmarks: filters, which determine what is fetched from the log and which of those entries are displayed, and search tools which don’t alter what is shown of the log, but take you to particular content.
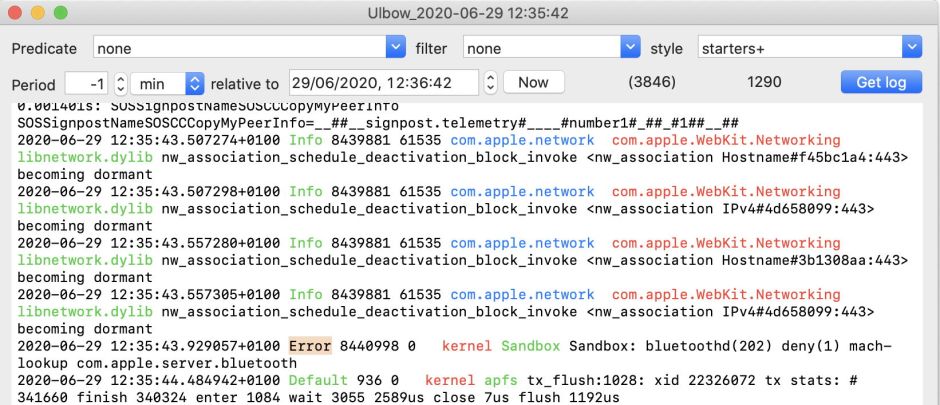
The most powerful filters are predicates, which are the only tool which is available in all methods of accessing the log – the log command, Apple’s Console, and my Ulbow and Consolation apps. The power of predicates is that they determine which entries are collected from the log, but their disadvantage is that entries which don’t satisfy your predicate will be omitted from the log excerpt altogether; the only way that you can view those is by using a different predicate and getting a fresh log extract.
Predicates are powerful, but potentially complex. At their simplest, an example could be
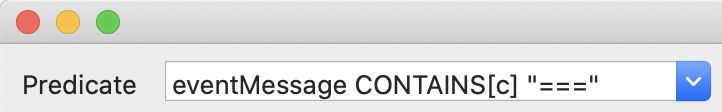
eventMessage CONTAINS[c] "==="
which will fetch only log entries whose eventMessage field contains the (case-insensitive) characters ===. A more complex example which I use regularly is
subsystem == "com.apple.TimeMachine" || eventMessage CONTAINS[c] "backup" || eventMessage CONTAINS[c] "Time Machine" || eventMessage CONTAINS[c] "TimeMachine"
which fetches all log entries for which the subsystem is com.apple.TimeMachine, or which contain any of those terms in their eventMessage field.
I’ve written a guide to predicates which is summarised in Ulbow’s Help book.
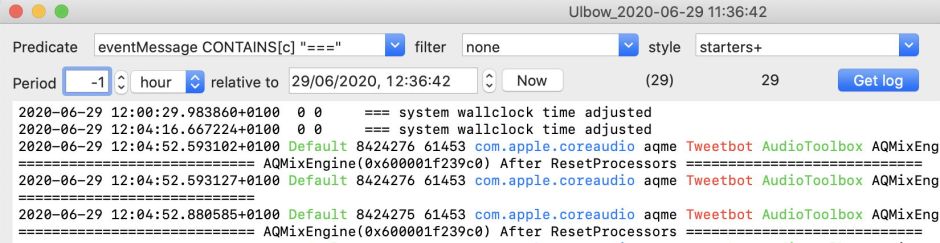
Predicates are wonderful when you know exactly what you’re looking for. Because they should reduce the number of log messages returned, they’re also invaluable for locating landmarks in long periods. To return to the problem of discovering when your Mac started up, it’s relatively quick and simple to use a predicate to locate the characters === which appear at startup and some other times, by setting that predicate for periods of 30 minutes or an hour at a time.
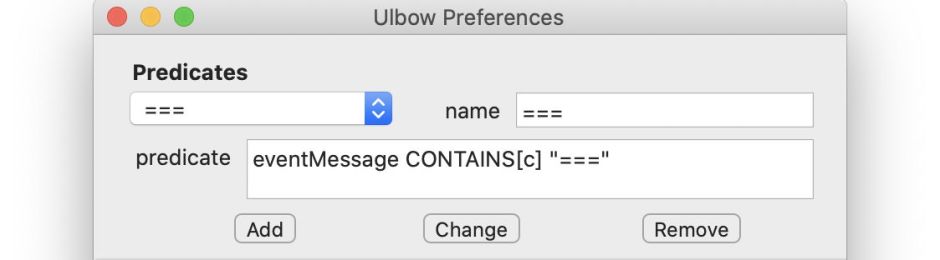
In Ulbow and Consolation, you can create your own predicates which will then appear in the Predicate menu, in the app’s preferences. When you’ve added a predicate to that menu, it will be shown there using the name you’ve given it. To get a log extract using that predicate, select it in the Predicate menu and click on the Get log button.
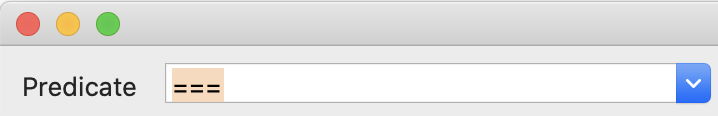
You can also type the predicate into the combo box to use it as a one-off. Note that you must then enter the whole predicate, as shown.
Searched over a period of 1 hour, there are only 29 log entries which contain ===, making them extremely easy to check through.
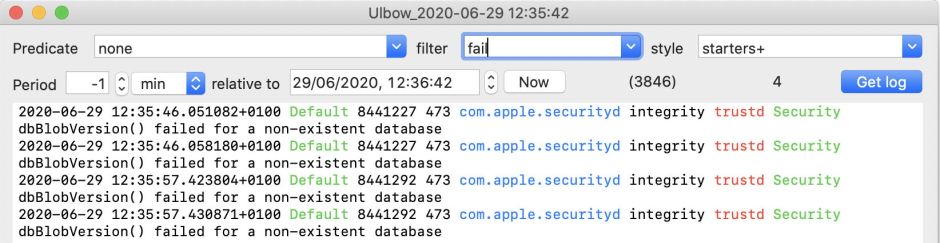
The other type of filter which Ulbow and Consolation offer doesn’t affect what is obtained in the log extract, but determines which entries from it are displayed: the filter. You can compose your own in preferences, which adds them to the popup menu in the filter control, or you can simply type them in as you need. If you make the first character an asterisk * then it is treated as a regular expression (regex), otherwise a simple case-insensitive text search will be used.
Because this is actioned within Ulbow or Consolation, filtering is performed when you select an item in the popup menu, or press the Tab or Enter key when you type in a search term directly. There’s no need to obtain a fresh log extract each time, making this almost instant.
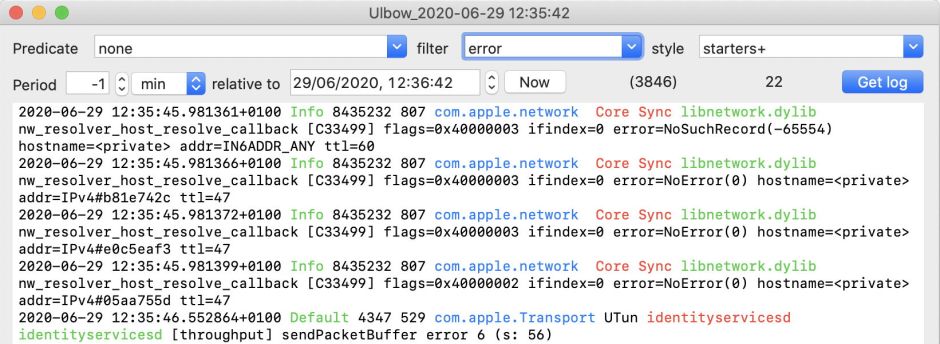
It’s also ideal for one-off filtering. Simply type in the term and press the Tab or Return key.
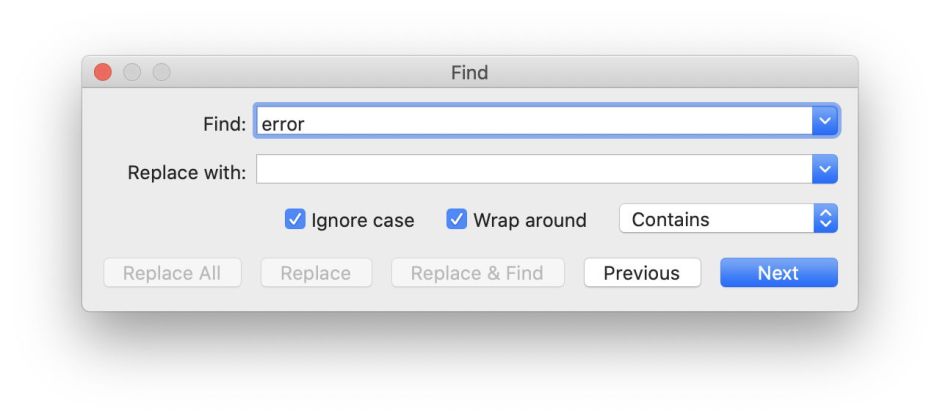
Predicates determine what is fetched from the log, and filters determine which of those messages are shown, but if you want to continue to display the same log entries and just find text within it, use the Find command in the Edit menu. To enable that, you may have to click on the logs displayed in Ulbow’s window. A normal Find dialog then appears, and you can search the whole text of all currently displayed entries.
Ulbow has two further features which are of particular use when trying to find your way around the log: custom styles and its chart view.
When you’re reading log entries, you often want as much information as you can make sense from, and will use one of the styles such as starters+. When you’re trying to scan through many log entries, displaying less of each can be advantageous. Consider a clean style such as
0hr 4b 10t
which produces a minimalist view:
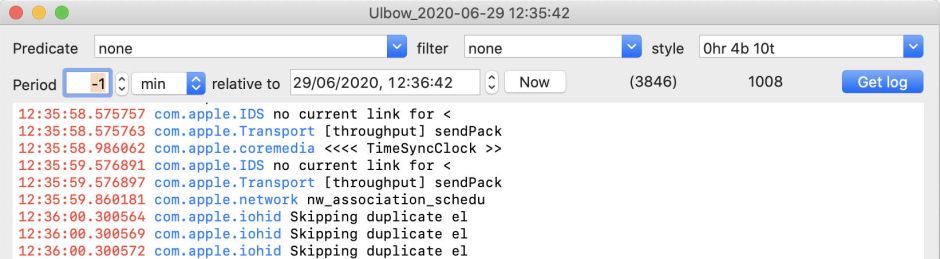
You can add that style to the style menu in preferences, or simply type it in on the fly, then press the Tab key to apply it. This displays field 0, the datestamp, giving only the time in red (0hr), then the subsystem in blue (4b), and a truncated view of the start of the eventMessage field. Styles are fully documented in Ulbow’s Help book.
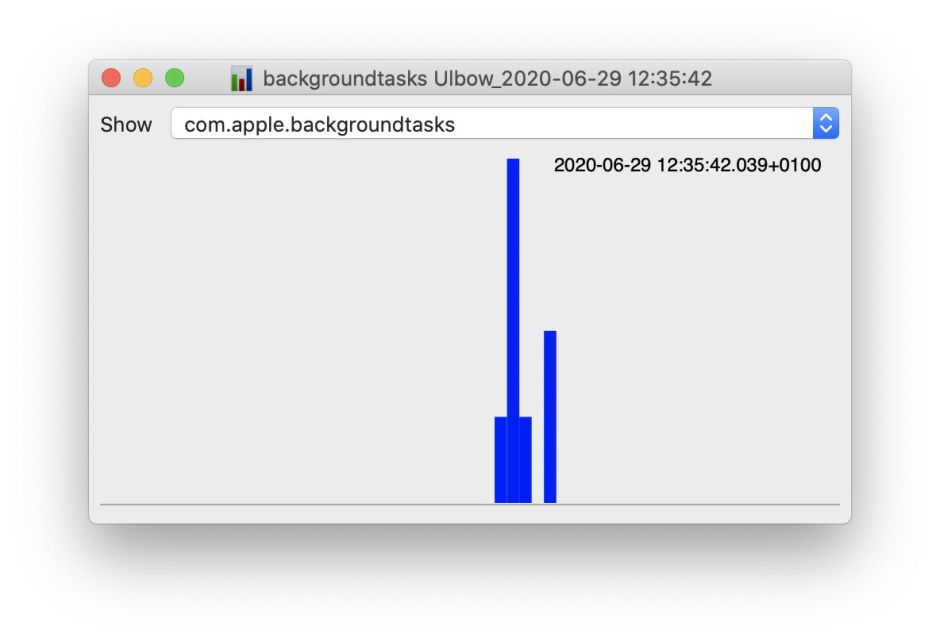
Finally, the most powerful of all Ulbow’s tools, not available anywhere else, is its chart view. I’ve already shown how you can use it to locate a kernel panic, as one example.
Ulbow’s Help book contains much more information, including some notable landmarks which you can use to get started and find your way around the log.
