

I have now added the remaining features which I intend to go into Ulbow’s next release, and welcome you to try them out in version 1.1b3.
Major changes include:
- You can now save a Chart view as a PNG file.
- There’s a new ‘spot time’ feature in Chart view, which I explain below.
- You can now edit the Period directly, although there’s one remaining small bug with this, in that switching from direct editing to using the stepper control can change the figures more than you expect. This is because, at present, the stepper still remembers the last Period, and not that entered as text. I am working on a fix for this.
- You can now copy and paste date-time settings from one window to another.
- There is an option to get debug log entries too.
To explain how this ‘spot time’ feature and pasting of date-time settings change the way you can browse the log, here’s an example of how you can use them to locate a problem and investigate it in the huge haystack of log entries.
Pinning down exactly when something occurred in the unified log can be very frustrating. In this workthrough, I’ll assume that we know the event in question occurred within a period of a minute. So the first browser window is set with that period of 1 minute, which here returns nearly 20,000 log entries. Searching through those is simply not practical unless you know what you’re looking for.

Open a Chart, and you’ll see over two thousand of those entries, that’s more than 10% of them, are confined to one narrow bar.
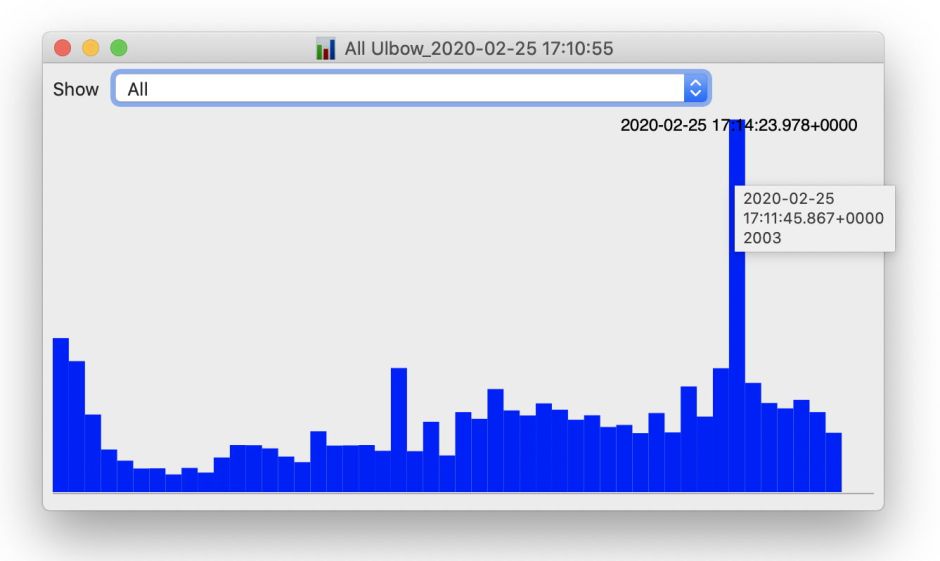
Looking through different subsystems shows a peak of activity in several around the same time. Because the X axes of the Chart view remain unchanged throughout, this is straightforward to see. One nuisance here is that a lot of those entries didn’t come from named subsystems, but appear in the [nil] section.
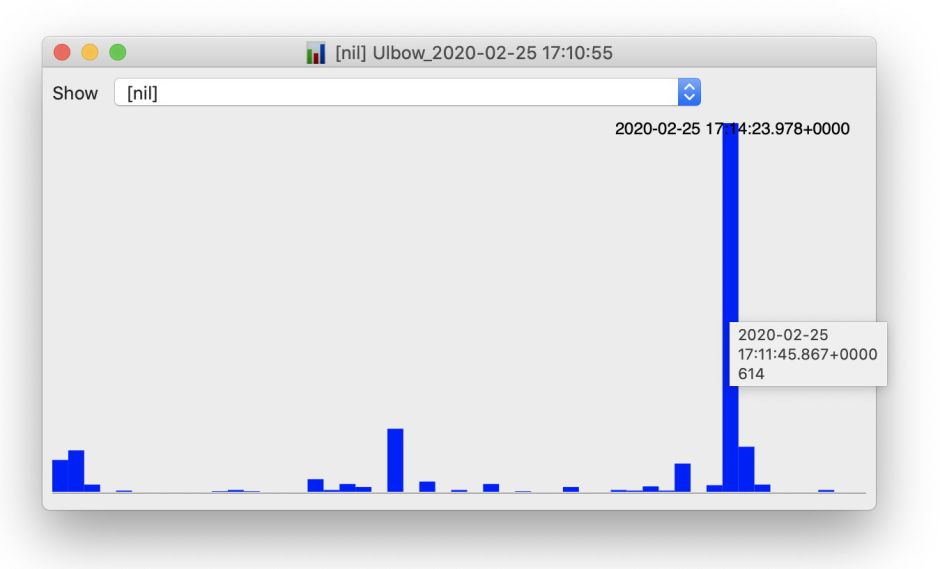
In any of those Charts, Command-click on that very high bar, which sets the time at the top of the window and copies it too. Looking at the tooltips for neighbouring bars, the period concerned is only about 2 seconds in length.
Open a New document from the File menu, select any part of the date-time control there, and press Command-V to paste in the start of that busy period in the log. Then set the Period to 3 seconds, to ensure you capture all that activity, and click on Get log.
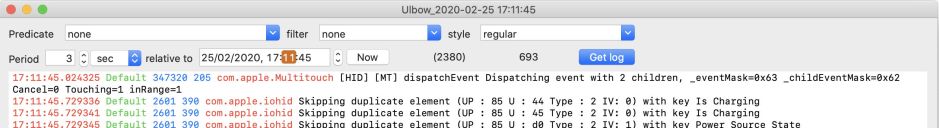
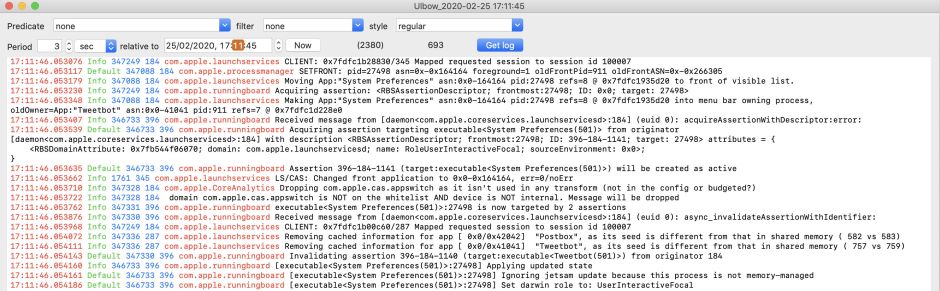
In those three seconds, there’s a total of more than 2,000 log entries, which are far more browsable now. A Chart view always helps as a start.

It’s now quick to scroll down and discover that, in this case, this brief but intense flurry of activity was the result of changing the frontmost app.
This new version displays and saves slightly different versions of the Chart view. In the app, the top right of the Chart view proper now displays the starting time of the last bar that you Command-clicked.

As that’s ephemeral information, but the subsystem being displayed wouldn’t otherwise be shown in the saved PNG, below is the PNG version for comparison.

Ulbow version 1.1b3 is now feature-complete, and once any remaining bugs have been fixed will proceed to release. It’s available from here: ulbow11b3
from Downloads above, from its Product Page, and via its auto-update mechanism.
I am aware of one obscure bug which is truncating the start of the Chart data, which I am intending to fix for the release version. I’d greatly appreciate any other reports, and remaining feature requests, please.
