

Navigating the unified log is a difficult task. With so many log entries occurring, when you’re looking for something important, it’s just like trying to find a needle in a haystack, or two. This new version of my free log browser Ulbow introduces a Chart View which in many situations makes navigation a great deal easier.
Although this is a first beta-release, I recommend this for all users, as it now names browser windows using the start time of the log excerpt: this should make it less confusing when you have more than one window open. You can disable the other new features by turning off the Enable Chart View command in the app menu, if you wish.
The idea of a Chart View of the log goes back to my older log browser Woodpile, which sadly no longer works properly with recent versions of macOS. Perhaps the best way to understand how it works is to explain how Ulbow creates it.
From this version onwards, when you get a log extract by clicking on Ulbow’s Get log button, once its contents have been displayed in the normal document window, a background task parses the whole of the log extract (not just the limited display). Once that’s complete, which is usually almost immediately, a new menu command Open Chart appears in the Window menu.

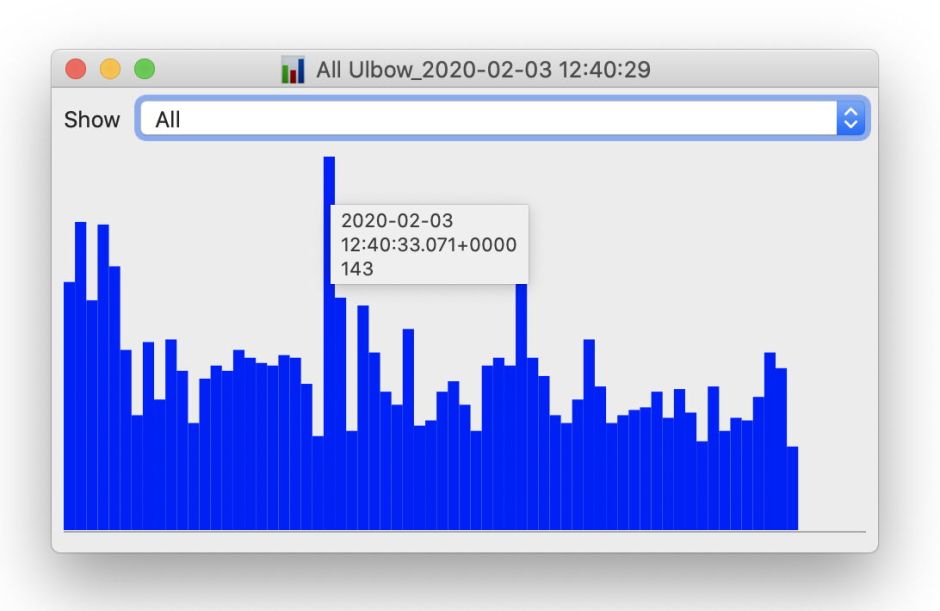
When you open a chart, it first displays a frequency chart of all log entries over the period of the extract. This gives you an immediate impression of when the greatest log activity occurred. Hover the pointer over any bar in a Chart View and a tooltip will appear showing the date and time of the start of that frequency bar, and the number of log entries which it represents.
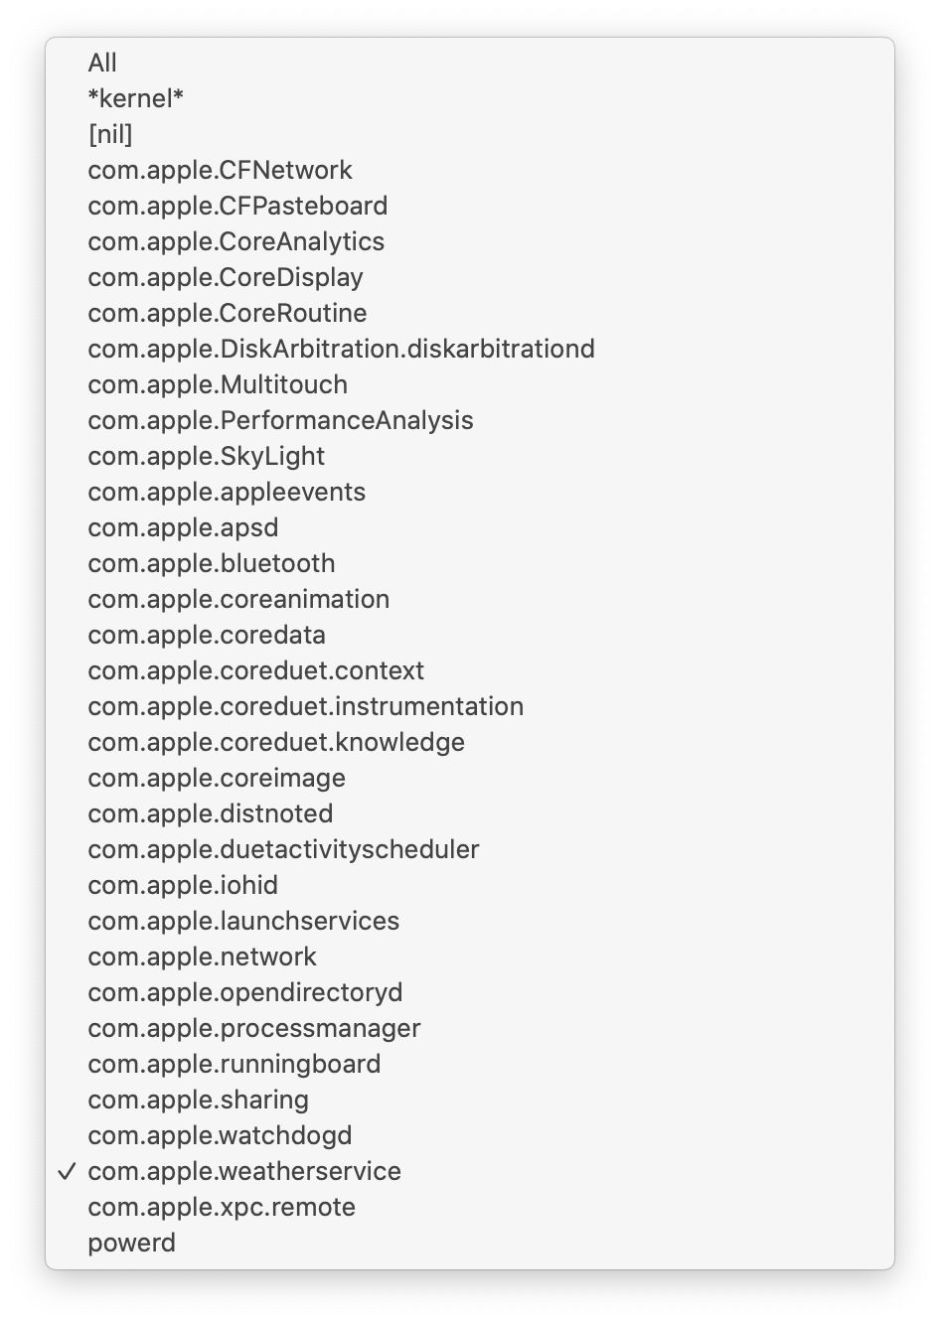
Ulbow also builds a list of all the subsystems found in the log extract, and puts that into the Show popup menu. You can then switch a Chart View from displaying the frequencies of all log entries to those from just that specific subsystem, e.g. com.apple.TimeMachine. Some of the most important log entries come from the kernel, which doesn’t have an associated subsystem, so is available in its own right. Other entries lacking a subsystem are put together in another category of nil.
In previous versions, tools to locate entries from specific subsystems are relatively crude: you can use a predicate which includes them, but excludes much else, or you can search for the subsystem name. This is usually even harder for kernel entries.
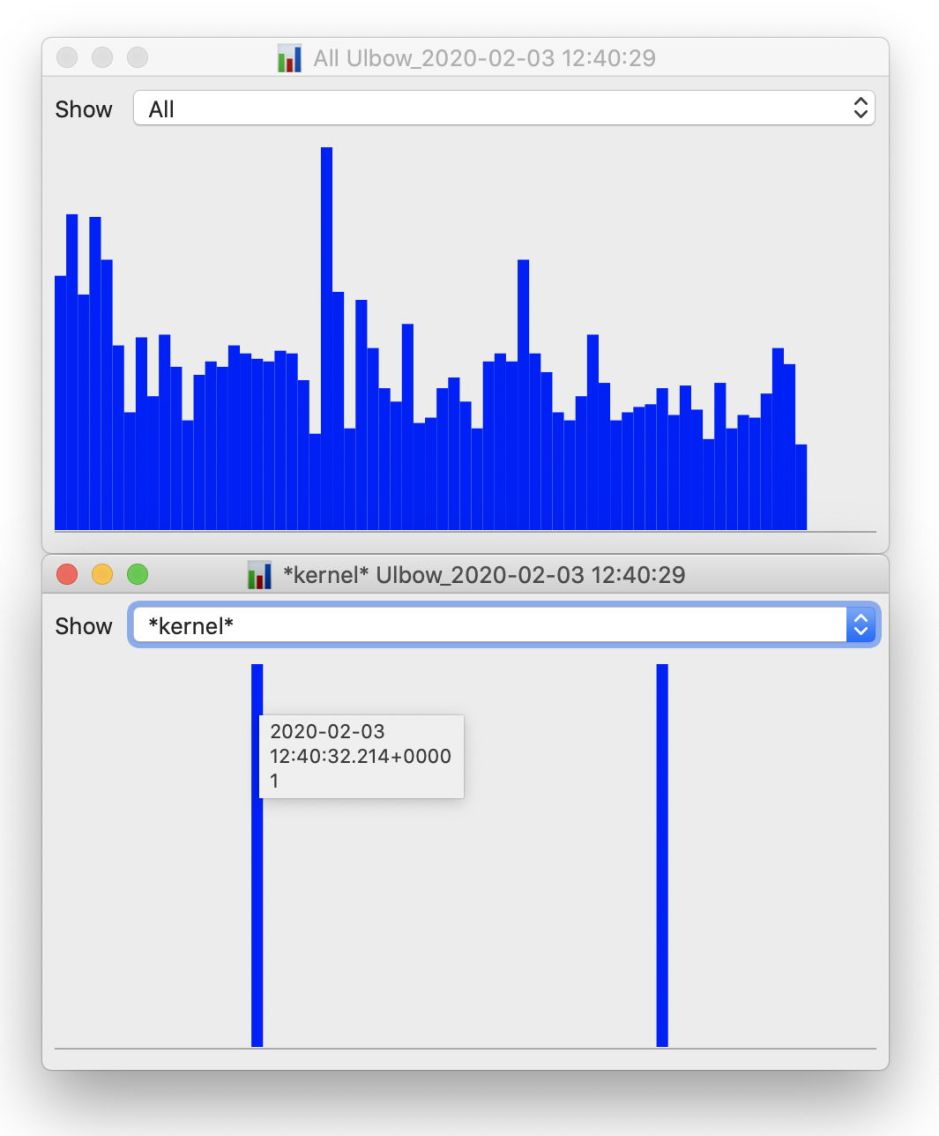
With a Chart View open, all you have to do is switch its popup menu to show kernel entries, then read the start time of that collection period from the tooltip which appears.
The contents of the popup menu are themselves a great help, as they tell you which subsystems are worth searching for in that log extract.
Using two or more Chart Views, you can see graphically how different subsystems interact. This example is taken from a log extract containing entries which might be related to Time Machine backups over a period of three hours. The upper display shows frequencies of all log entries, which are centred on the three periods during which backups were made. The lower chart shows entries for DAS, which schedules automatic backups, so those show the early stage of each of the backups captured here. If DAS had failed during this period, those would largely disappear, and the backups themselves become irregular.

By cicking/tapping on the Chart View, it will increase the number of bars to make their time resolution finer, and right-clicking does the reverse. Because Chart Views use their own document data rather than relying on the displayed log extract, you can close the log browser window and still keep its Chart Views open.
There are three minor issues that I’m aware of with this beta-release:
- Although menu commands allow it, trying to Save or Save As a Chart view fails with a non-fatal error.
- You can still obtain second and other log extracts in the same document main window. Those don’t update any open Chart Views, though. If you want to obtain another log extract, you can still do that, but it may be simpler to do so in another document main window.
- Older versions of macOS like Sierra don’t normally use subsystems as extensively as Catalina, so you may find more entries being recorded as [nil].
If you ever use the log, or have wanted to be able to, you should find this new version of Ulbow a revelation. It’s available from here: ulbow11b1
from Downloads above, from its Product Page, and through its auto-update feature.
