

Another common problem which we used to use Console for in the past, before Sierra introduced the unified log, is a crash, typically of an app. Working out what led up to that crash was an essential bit of diagnosis which helped us get on with the job. Sometimes crashes are hard to reproduce, and you can only look back at what went wrong – something which the current Console app makes hard. This was another compelling reason for me to develop Consolation.
This tutorial works through how I investigate a crash using Consolation 3.
1. Ensure Consolation has custom styles, etc.
If you haven’t used Consolation 3 before, ensure that you set it up with the supplied custom settings for its Styles and other tools. Go to the Consolation3 app menu and select the Import custom settings… command. In the Open File dialog, locate the custom Property List supplied which is appropriate to the version of macOS which you’re running, and Open it. The file for Mojave is named Consol3CustomsMojave.plist, for example. Once that has been read in, you should find several new options in the Style popup menu, and those for saved predicate and filter.

Then set the controls to useful defaults:
- Log source to system, as we’re working with the current live log rather than a logarchive bundle;
- Filter to other text, with the box next to it empty, to capture all log entries;
- Style to basic+, with the next two boxes ticked, but in the Show boxes uncheck signposts and activities;
- Period set to 0, as we’ll be working with Start and End times.

To ensure these are all written into Consolation’s preferences file, click on the Save as defaults button at the top right of the window.
Now, when you open a New window, it will come up with those settings as its defaults, saving you work.
2. Clear the decks
If you can reproduce the crash, the best way to investigate it is by running your Mac as clean as possible, and performing the action which triggers the crash at a set time, such as on the minute, so you know exactly where to look in your log.
Cleanliness is reflected in the log. If you leave apps running which periodically access iCloud, every so often the log will flood with all the chatter which that produces. You don’t have to start up in Safe mode, but reducing the noise in the log is well worthwhile. It’s also wise to time your test crash well away from scheduled events like Time Machine backups.
3. Finding a previous event
If you can’t reproduce your crash, but have to go back and look at an event in the past, you don’t have the option of cleanliness, of course. So long as you have a fairly accurate estimate of when the event happened, within a few seconds, it shouldn’t prove hard to locate. If you’ve not got an accurate time, you can try searching the log for signs of the app’s activity. To do this, set the Filter to a single predicate with a pattern of eventMessage, operator CONTAINS[c], and put the app’s name in the text box. Increase the Period to 20 min or so and click on Get log.

If that doesn’t find it, you can switch the pattern to processImagePath, senderImagePath, or subsystem and repeat Get log.
4. Reproduce the crash
In this case, my reproducible crash is a ‘quit on open’, an app which I know will immediately crash whenever I try to open it. I get this set up and ready to trigger in the Finder, having selected the app icon well before it’s time to open the app. Selecting an app icon itself generates plenty of log entries, whereas merely double-clicking it should look nice and clean in the log, and instantly recognisable. I watch the menubar clock tick round, and exactly on the minute, with the seconds showing 00, I double-click the app’s icon to open it.
Leave your mouse or trackpad alone for ten seconds or so, dismiss any alert, and switch back to Consolation.
Because we’ve already set up the right default window, open a New window there, and set the Start time to a second or two before you opened the app, and the End time to 10-30 seconds later. If you’re doing this in Sierra, go for the longer window, as the log show command isn’t always as precise there, but in Mojave you can use just ten seconds. Then tick the Show activities checkbox in the Style section just for now – that ensures that we can see the double-click as a sendAction.
5. Start at the beginning
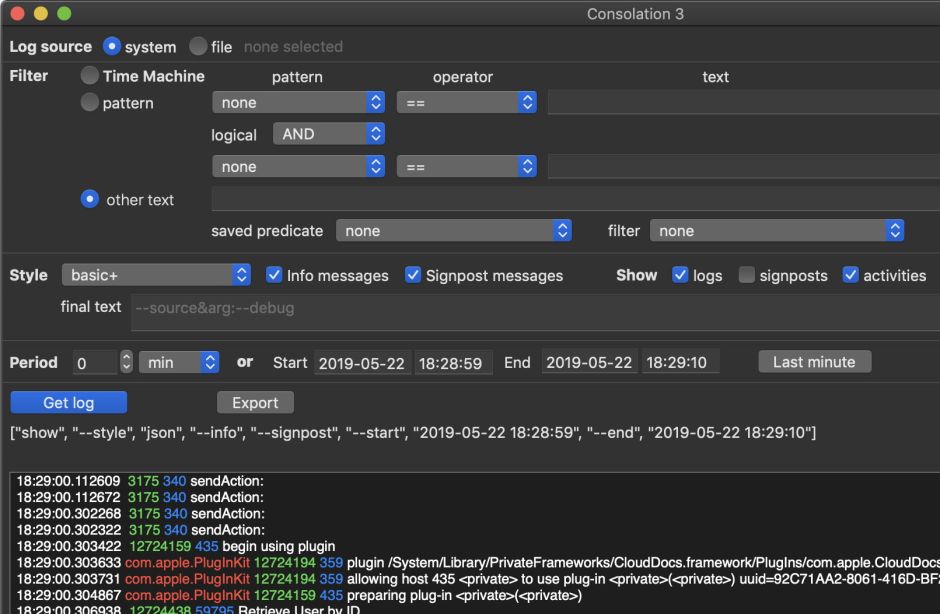
When you click on Get log, you should see a reasonably short extract, towards the top of which are multiple sendAction activities for your double-click.
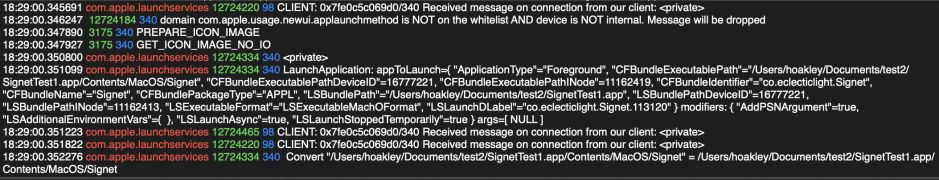
From there, scroll down until you reach entries with com.apple.launchservices in red. This is where macOS is starting to handle the launch of that app seriously, and early on you should see one of those entries starting with LaunchApplication, containing the full path to the app which you opened.
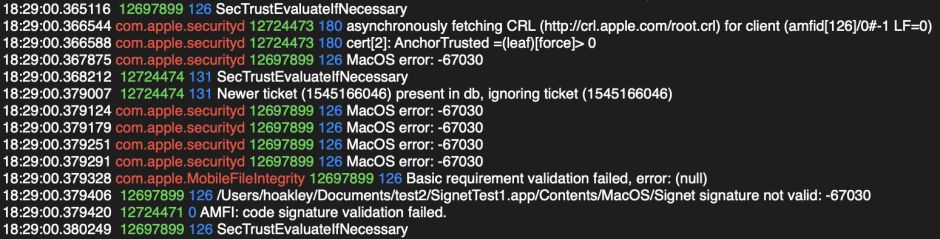
A little further down, during the launch sequence, you’ll see the macOS security system kick in, following the invitation of SecTrustEvaluateIfNecessary. In my example, the reason for the crash becomes evident very quickly: a series of macOS errors of -67030, indicating an invalid app signature.

Further down, com.apple.MobileFileIntegrity reports Broken signature with Team ID fatal. After that, LaunchServices appears to proceed with preparing to open an app which is now doomed if not already dead. This curiously adds our fatally flawed app to the Recent Items menu, but eventually LaunchServices realises what has happened, and records its death.
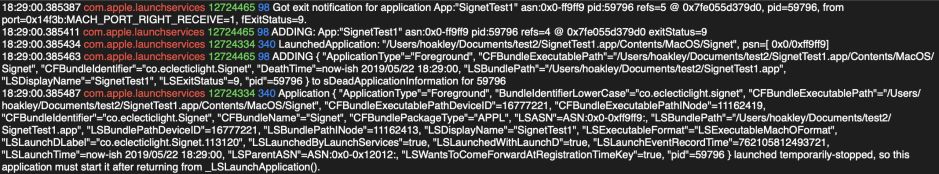
Finally, there’s a lot of chatter during the cleanup, and macOS gets back on with its many background tasks.
6. Look at the detail
Because we’ve been doing this in a custom style, for which Consolation uses the log extract in JSON format, there’s a great deal more we can explore without changing the Period settings or getting a fresh log extract. Switch the filter menu to read error, for example, and you’ll see just those log entries in which that word appears in the eventMessage field. Change the Style to starters+ and you’ll see a fuller listing of fields for each entry, which is ideal when you want more detail and have located the moment at which an error occurred.

If you’re really struggling with a flood of entries, you can limit those collected using the Filter section. For example, in the saved predicate menu is one for com.apple.securityd itself. To apply that, you’ll have to click on Get log again, though.
Consolation often provides alternative ways of achieving the same result. For example, to see all log entries from the security system com.apple.securityd which contain the word error in their eventMessage, you can either:

set other text in Filter, and use the com.apple.securityd saved predicate with a filter of error
or
set pattern in Filter, then set the first pattern to subsystem, operator ==, text com.apple.securityd, with a logical AND to a second pattern of eventMessage, operator CONTAINS[d], and text error.

This gives great flexibility, as you can choose whichever works best in your exploration of the log at the time. The pattern predicates enable you to enter text very quickly, whereas those stored in saved predicates are for more frequent use. Setting a filter there is dynamic, but only applies to the eventMessage field, whilst a predicate in pattern can apply to any of the fields available in the pattern popup.
Happy hunting!
