
Before Apple introduced the unified log, a standard technique to identify what was going wrong with an app when you tried to do something, was to perform that action, then look at what had happened in Console. Try this now with Console, and it’s like looking for a needle in a haystack, with the haystack scrolling past at a rate of knots. So most users have given up trying to access the unified log, and have to troubleshoot problems in different ways.
This article explains how you can still use the unified log to discover what is going wrong, with the aid of my free app, Consolation 3. It’s actually easier than it was back in El Capitan.
The only thing that you need to know is what action(s) will trigger the problem, and that it is reasonably reproducible, just as you did back in El Cap.
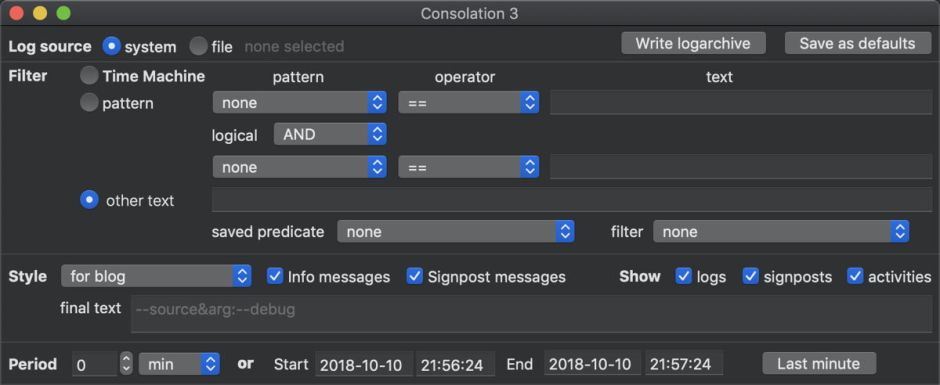
Next, close all apps other than the one which is suffering the problem, and park all other windows in your Dock. Open Consolation 3, and set it up as follows:
- Log source to system.
- Filter to other text, with the text box next to it blank. This will ensure that all messages are extracted from the log.
- saved predicate and filter popups set to none.
- Style popup set to the style that you want. Ideal are minimal styles like basic+ which is
0h 4r 6g 9b 10, or my for blog which displays just the time, subsystem and eventMessage using colour in a style string of0hb 4r 10. These are easy to add in Consolation’s Preferences. - Info messages and Signpost messages both ticked.
- Period set to 0 (zero), so that you use Start and End times which you will set later.
Then switch to the app, and watch the clock ticking the seconds away. When it reaches a second value of 00 (or 30), as precisely as possible but not before that moment, perform the action which you want to investigate. As soon as you have done that, leave your mouse/trackpad and keyboard alone.
As the clock ticks towards 30 seconds after you made that action, switch to Consolation’s window. On, or just after, 30 seconds elapsing since you triggered the problem, click on the Last minute button in Consolation’s Period section. This should set the Start time to 30 seconds before the event, and the End time to 30 seconds afterwards.
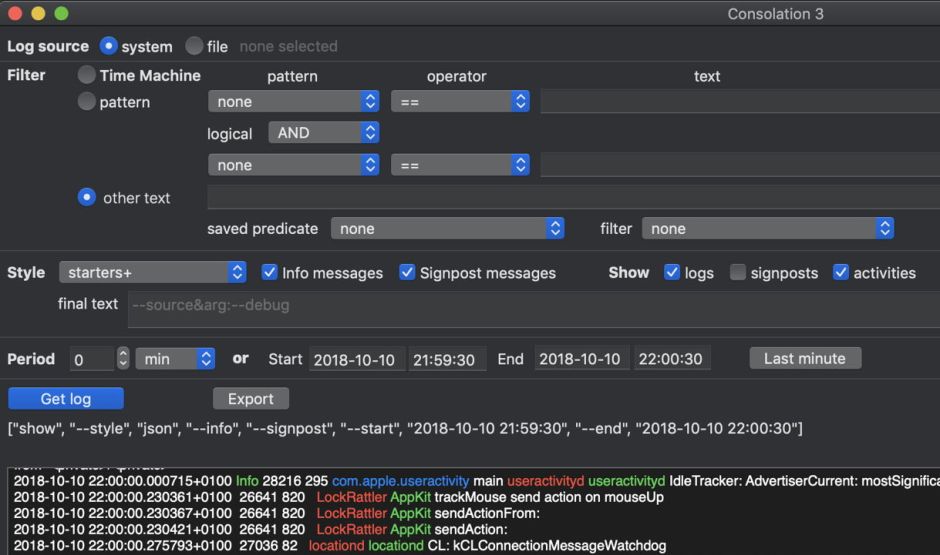
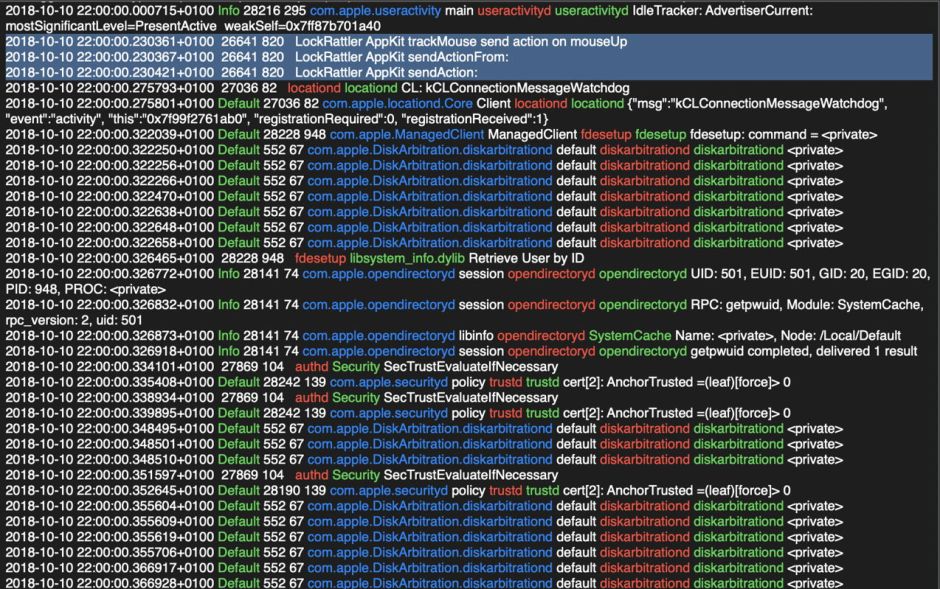
Once the log extract is returned, scroll down to the time that you triggered the event. Use non-destructive controls such as the Style popup and Show checkboxes to view your log to display what you want. If you wish, you can use search terms in the filter popup to refine the entries displayed by their eventMessage contents.
Because you have fixed Start and End times, rather than using a time period, you can also use other controls, such as patterns in the Filter section, but you will then need to get the log extract afresh each time that they change.
In Mojave in particular, you will find the Show checkboxes of value, as quite a few useful entries appear as activities or in signposts, or those can just clutter up what you want in the log extract. You can also easily switch between Styles which show relatively little, and those with full details like process IDs, provided that you keep to Consolation’s custom styles rather than those set by the log command (syslog, default and json).
You can always save an extract to RTF when you wish, using the Save command, for further examination or to send with a bug report.
