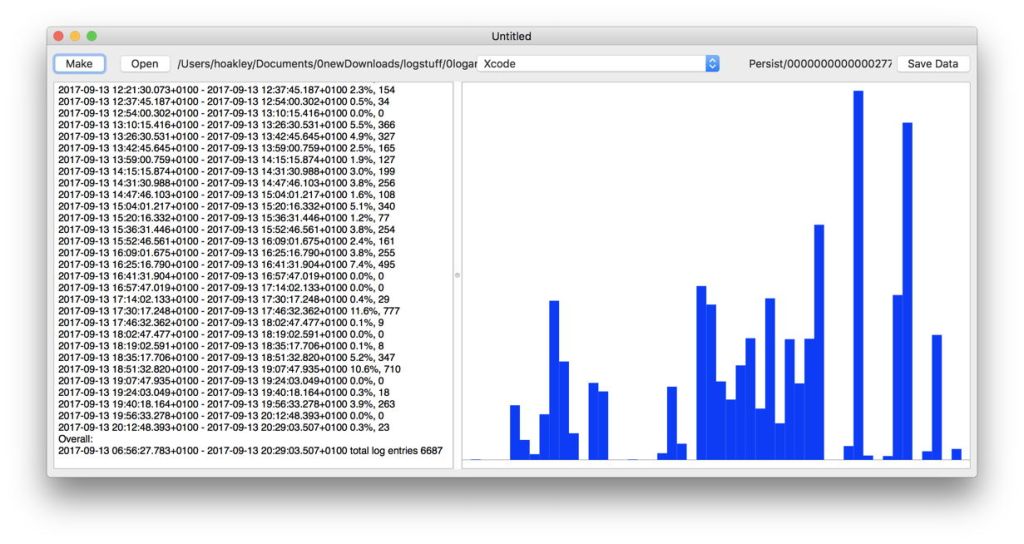
Let me demonstrate a little log magic: how to diagnose a performance slow-down on my iMac which occurred almost a month ago, when I was up to my eyes trying to get it to run as a dual-boot system with High Sierra.
You can’t do this with Console, which only examines live logs, or complete logarchives. You can’t do this with Consolation alone, as it has no way of looking broadly over existing log files, but goes in at a level of fine detail. You can’t do this with the log command in Terminal, not unless you do an awful lot of processing on its output.
The data you need are still in your logs, locked away in old .tracev3 log files. The first step, then, is to freeze those into a logarchive, something you can do easily using the current alpha release of Woodpile (or MakeLogarchive). It’s a three-click process:
- Click on Woodpile’s Make button.
- Navigate to the /var/db folder, and select that as the source.
- Choose a suitable name and location for the resulting logarchive file.
A logarchive like that is likely to contain tens of millions of individual log entries. These are readily analysed using Woodpile, with just two clicks:
- Click on Woodpile’s Open button.
- Select the logarchive file which you just saved.
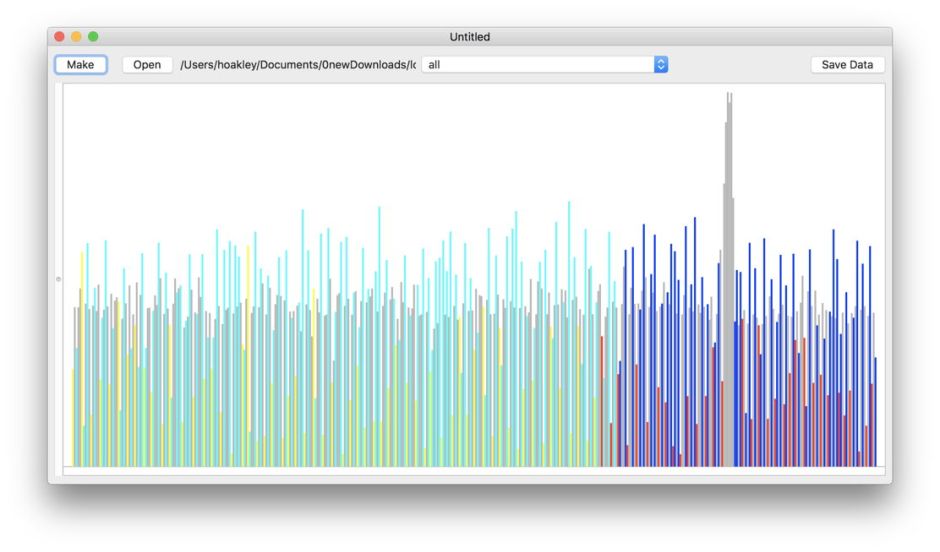
This displays a summary of log activity over the last three months, and shows you which of those log files are still available for access. Hover your pointer over the bars and you’ll see details about each in turn. As we’re here interested in system performance, a good place to start is with log entries made by the kernel. Normally, the kernel avoids idle chatter: when it writes to the log, it usually entails something important.
In the popup menu, select kernel. After a moment, a log load analysis for the kernel will be displayed.
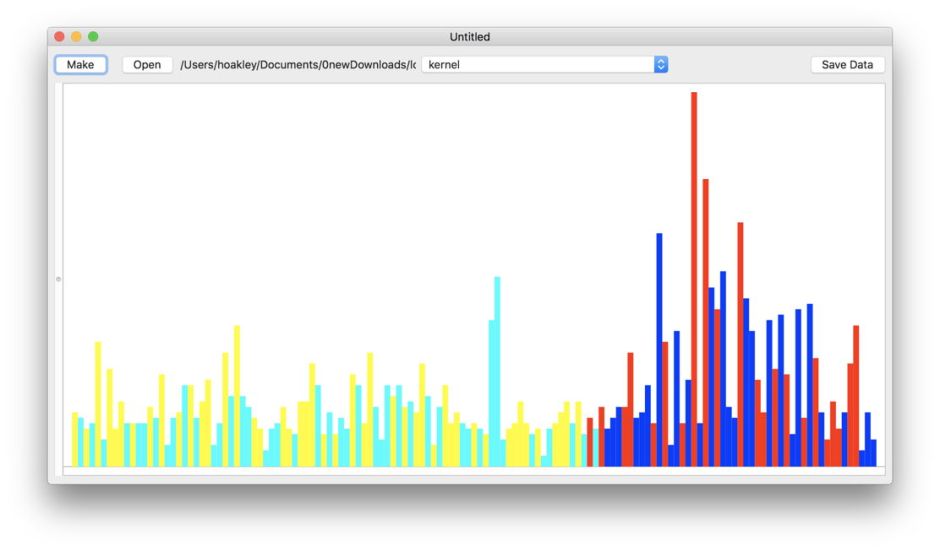
Hover your pointer over some of these peaks, and you can see further details for each. Those in dark blue or red are available for further analysis. Pick one of the peaks, and click on it.
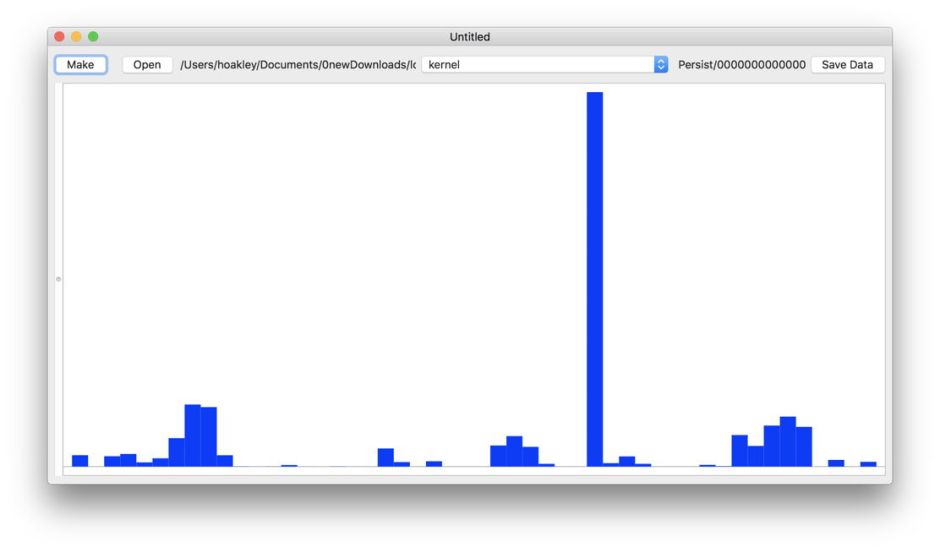
It takes Woodpile a few seconds to open the individual log file, extract the selected entries from its million or more log messages, and analyse their frequency over time. Please bear with it. Then you see a frequency chart covering the period from 09:37 on 27 September, to 17:37 that afternoon.
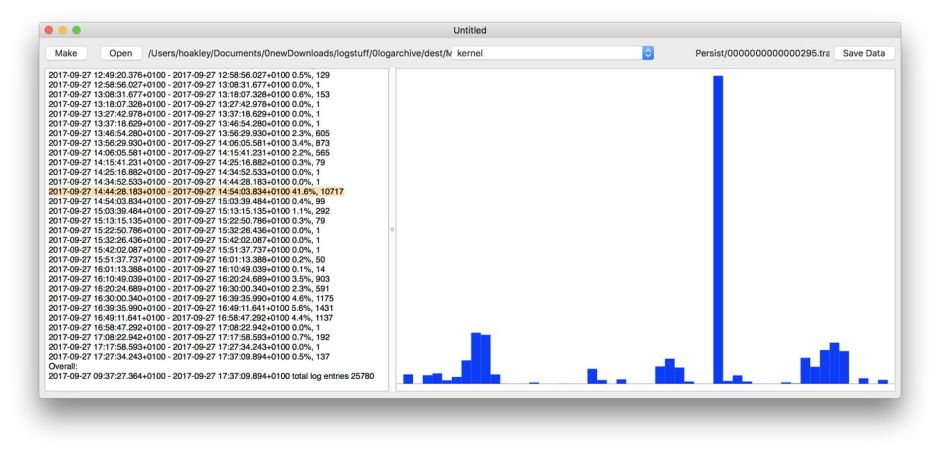
Within that period of eight hours (and hundreds of thousands of log entries), there is one really obvious peak in entries by the kernel. Hover over the bar, or reveal the data in the text pane, and you’ll see that occurred between 14:44 and 14:54. You have found the needle in the haystack.
At present, Woodpile won’t take you any deeper into the detail, and you’ll have to switch to Consolation. Open your copy of Consolation 3, click on the top radio button labelled file, and select the exact same .tracev3 log file which you are examining in Woodpile. It’s fine to keep both open at the same time for convenience.
Then set the Period to 0, and enter the same Start and End dates and times as given for that spike in Woodpile. To pick up kernel entries, I set the Filter to a pattern using the popup menus, for a processImagePath OR senderImagePath which CONTAINS[c] the text kernel. The other controls are set to your own preference. Then click on the Run command button.
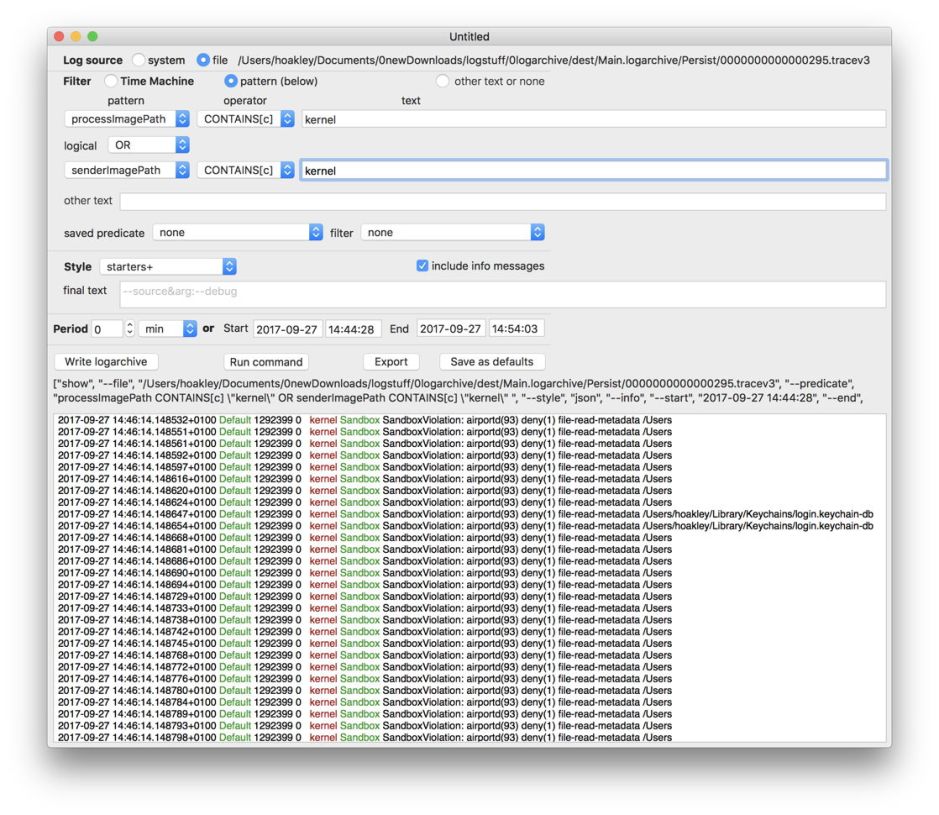
There you’ll see around 10,717 log entries by the kernel, in the space of a couple of minutes, all complaining about a Sandbox Violation when a process was trying to read a file’s metadata. A little bit of further exploration of the log – showing all entries, for instance, over a narrower time period – then takes you to the cause.
Woodpile version 0.4a1 is now available from here: woodpile10b1
and in Downloads above.
I hope that it helps you find your needle in a haystack.

