
Over the last few days, I have shown some of the inner secrets of the unified log system in macOS Sierra and High Sierra, and suggested how these might be used to approach the information collected in the logs in a radically different way. I’ve been using a development version of what was intended to be a tool to create logarchives, so appropriately named MakeLogarchive. It wasn’t supposed to start analysing the logs too!
As a first step along the path to developing a tool to support that new approach, I now offer Woodpile, in its first alpha release.
This takes the methods and code from MakeLogarchive and heads in a new direction. It can make a logarchive for you, as a matter of convenience, but its main function is to read in a logarchive and analyse all the log load information within it.
This now includes not only the regular log files stored in Persist, but also those stored in Special, and log entries analysed by logd in what it terms a Memory Rollover. I presume the latter log entries are those which are purged from short-term storage in memory, and not written to disk.
Unlike MakeLogarchive, then, Woodpile looks at log load data for everything captured by the unified log over the previous three months or more.
When you Open a logarchive in this way, Woodpile parses all these data into a hierarchy of dictionaries, which it keeps in memory. Part of its analysis includes checking all the processes for which there are summary data, those with significant log loads at some time during that long period. You can use a popup menu to select which of those processes you want to view: Woodpile then displays only those entries for your chosen process.
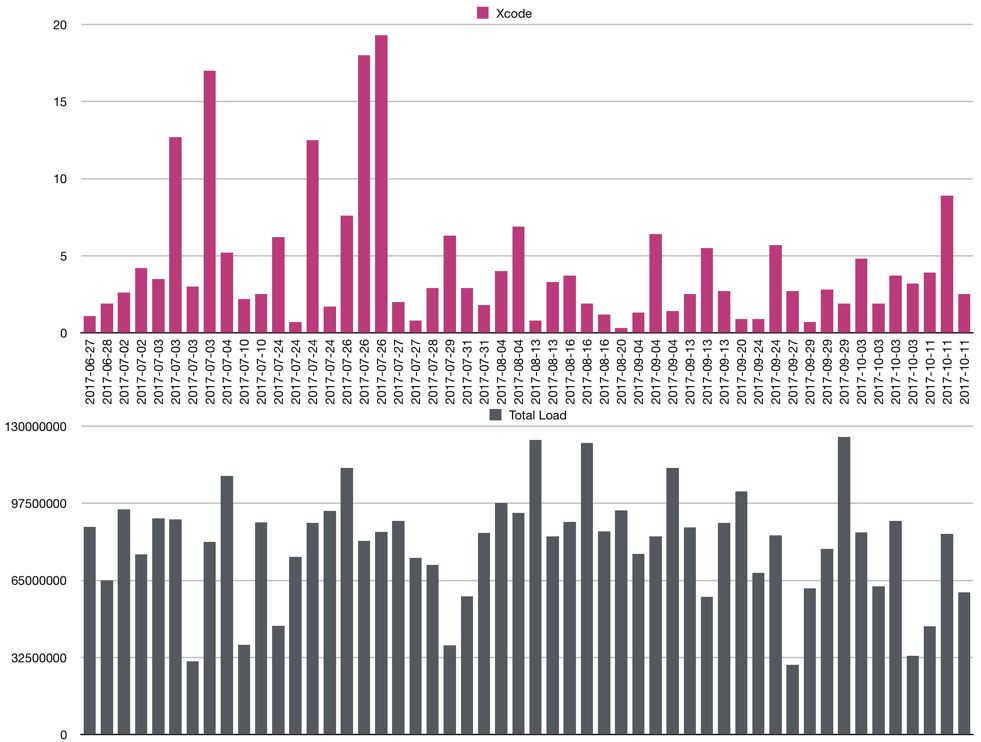
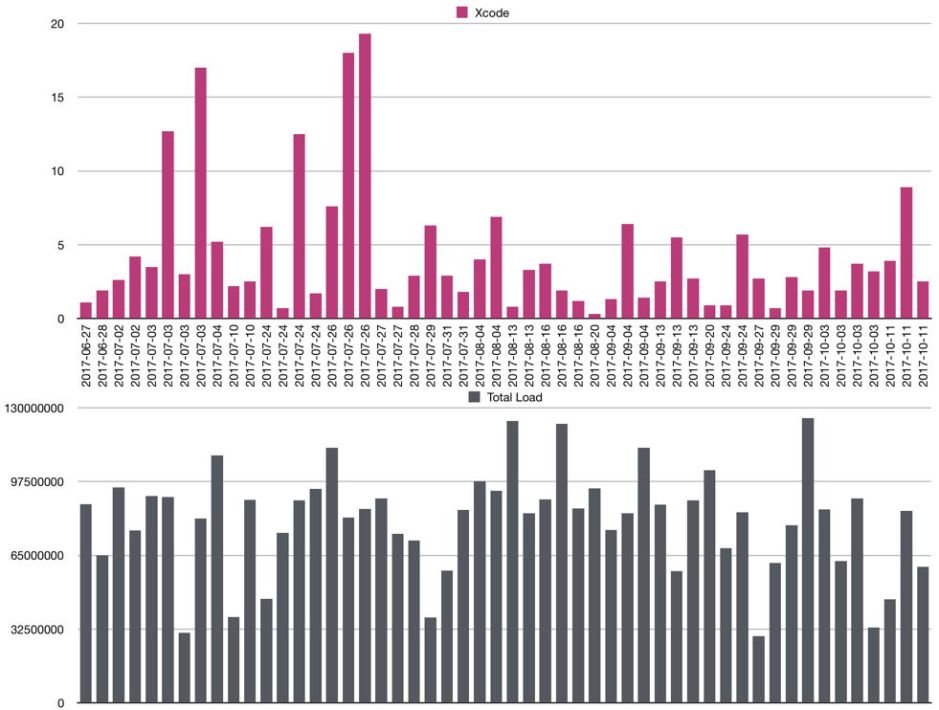
Here, for example, is its listing of all log load entries for Xcode over a period of three months.

Click on the Save Data button to write that to a text file, change its extension to .csv to ease importing it into Numbers, and sort the rows by date, time, and size. A few seconds later you have a chart showing the log load data for Xcode over that period.
My intention is that you will not have to do this outside Woodpile, but will be able to zoom in on a frequency chart for any selected process, identify a log file of interest, and then continue to zoom in using the entries in that log file (where they still exist in the logarchive).
However, I think this is a useful first step, which makes it much easier to get started with this type of analysis and see its potential. And if you do spot something of interest, you can investigate it further using Consolation 3.
Woodpile 0.1a1 is available here: woodpile10b1
and in Downloads above.
Please let me know what you think, and whether this has revealed anything useful to you.
Previous articles:
New insights into process performance: log load analysis
What’s your Mac been up to for the last 3 months? Inside macOS’s hidden activity records
Looking inside WebKit and the macOS dispatching systems using log data
