

Last week I showed some simple analyses of log data which revealed how the macOS unified log can reflect activities and patterns of app usage from many weeks earlier. In my second dip into the log data for the last 3+ months, I’m going to look at WebKit internals, and some of the undocumented macOS scheduling and dispatching system, CoreDuet.
These data were obtained from my iMac’s logd log as detailed in that previous article, and have been examined using Numbers.
You may recall from the previous analysis that the two processes accounting for much, sometimes the majority, of the log load were com.apple.WebKit.Networking and com.apple.WebKit.WebContent. In almost all log periods, the first process formed around 40% of the total log load, and the second came in a more distant second with around 8-10%. This is shown in my sample figures for a typical single log.
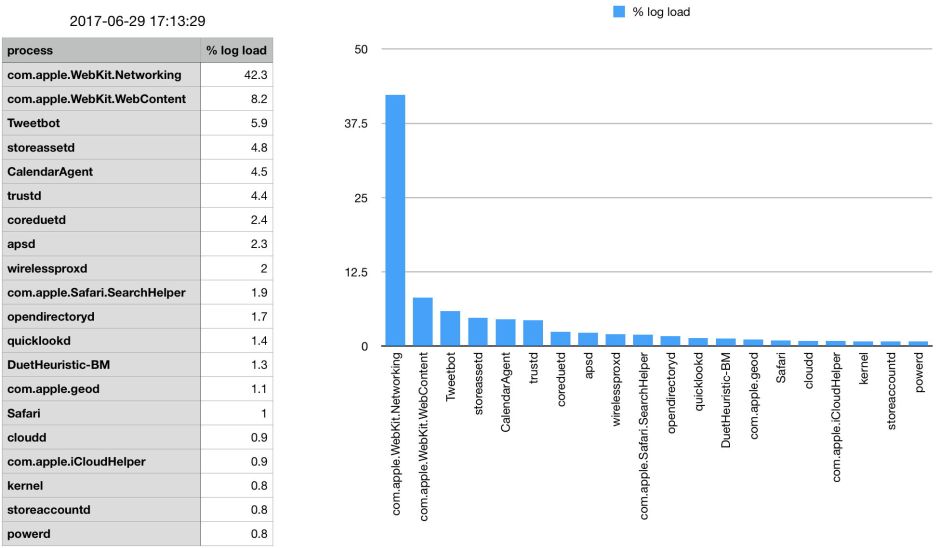
I’ve been unable to find any documentation describing these lower-level subsystems in WebKit, but presume from their names that WebKit.Networking is mainly concerned with handling web and related protocols and the communications functions within WebKit, while WebKit.WebContent is more about handling and rendering web content. WebKit is quite heavily used, not just by Safari, but by many other apps like the Finder’s Quick Look and Mail, to preview web pages.
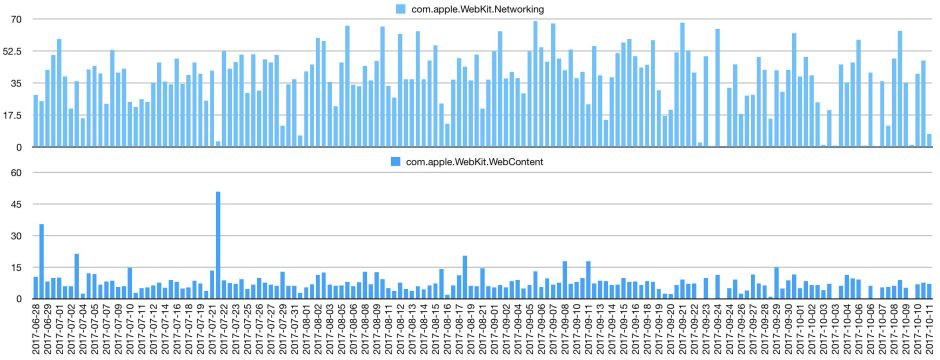
The top chart here shows the log load of WebKit.Networking over the period between 28 June and 11 October, and the chart below that shows the same for WebKit.WebContent. Over much of the period, the two go hand in hand: a quiet log in one is usually fairly quiet in the other, making them reasonable indicators of user activity, as you might expect.
However, there are some peaks which appear in WebKit.WebContent, notably that on 21 July, which do not tally with higher values in WebKit.Networking. Unfortunately, those peaks were in the more distant past, and the segment for which log files are still held is after 2 September, with only smaller peaks appearing in WebKit.WebContent then.
Looking back at the original data from logd‘s log, the log file in which the highest peak occurred in WebKit.WebContent (50.8% load) was unusually short. It is possible that this coincided with a period in which more log entries were put in Special log files, which are not included in this analysis.
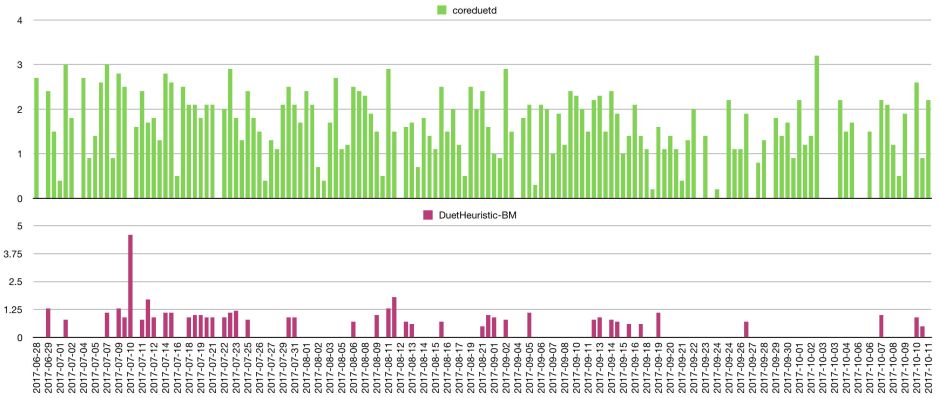
The other pair of processes which I want to look at here are those involved with monitoring of environmental and other conditions, and the management of scheduling and dispatching of background and other activities: coreduetd and the heuristics side in DuetHeuristic-BM. These are also undocumented, but coreduetd is the daemon responsible for calling off important activities such as the scheduling of Time Machine’s routine backups.
These are shown for the same period of log files in the chart above, and seem to follow quite complex patterns. Most notable are periodic dropouts in the coreduetd log load, and occasional spikes in both coreduetd and DuetHeuristic-BM.
One potential explanation of these is the known bug in macOS Sierra in which coreduetd (DAS) stops working normally after around 7 days of continuous running, resulting in failure of periodic tasks such as Time Machine backups – a problem which I have investigated in many previous articles here (and which seems to have been fixed at last in High Sierra).
To look at this in a more holistic way, I have combined these charts into one; as this is very busy, you can click on it to open it in a new tab/window, where it can be enlarged.
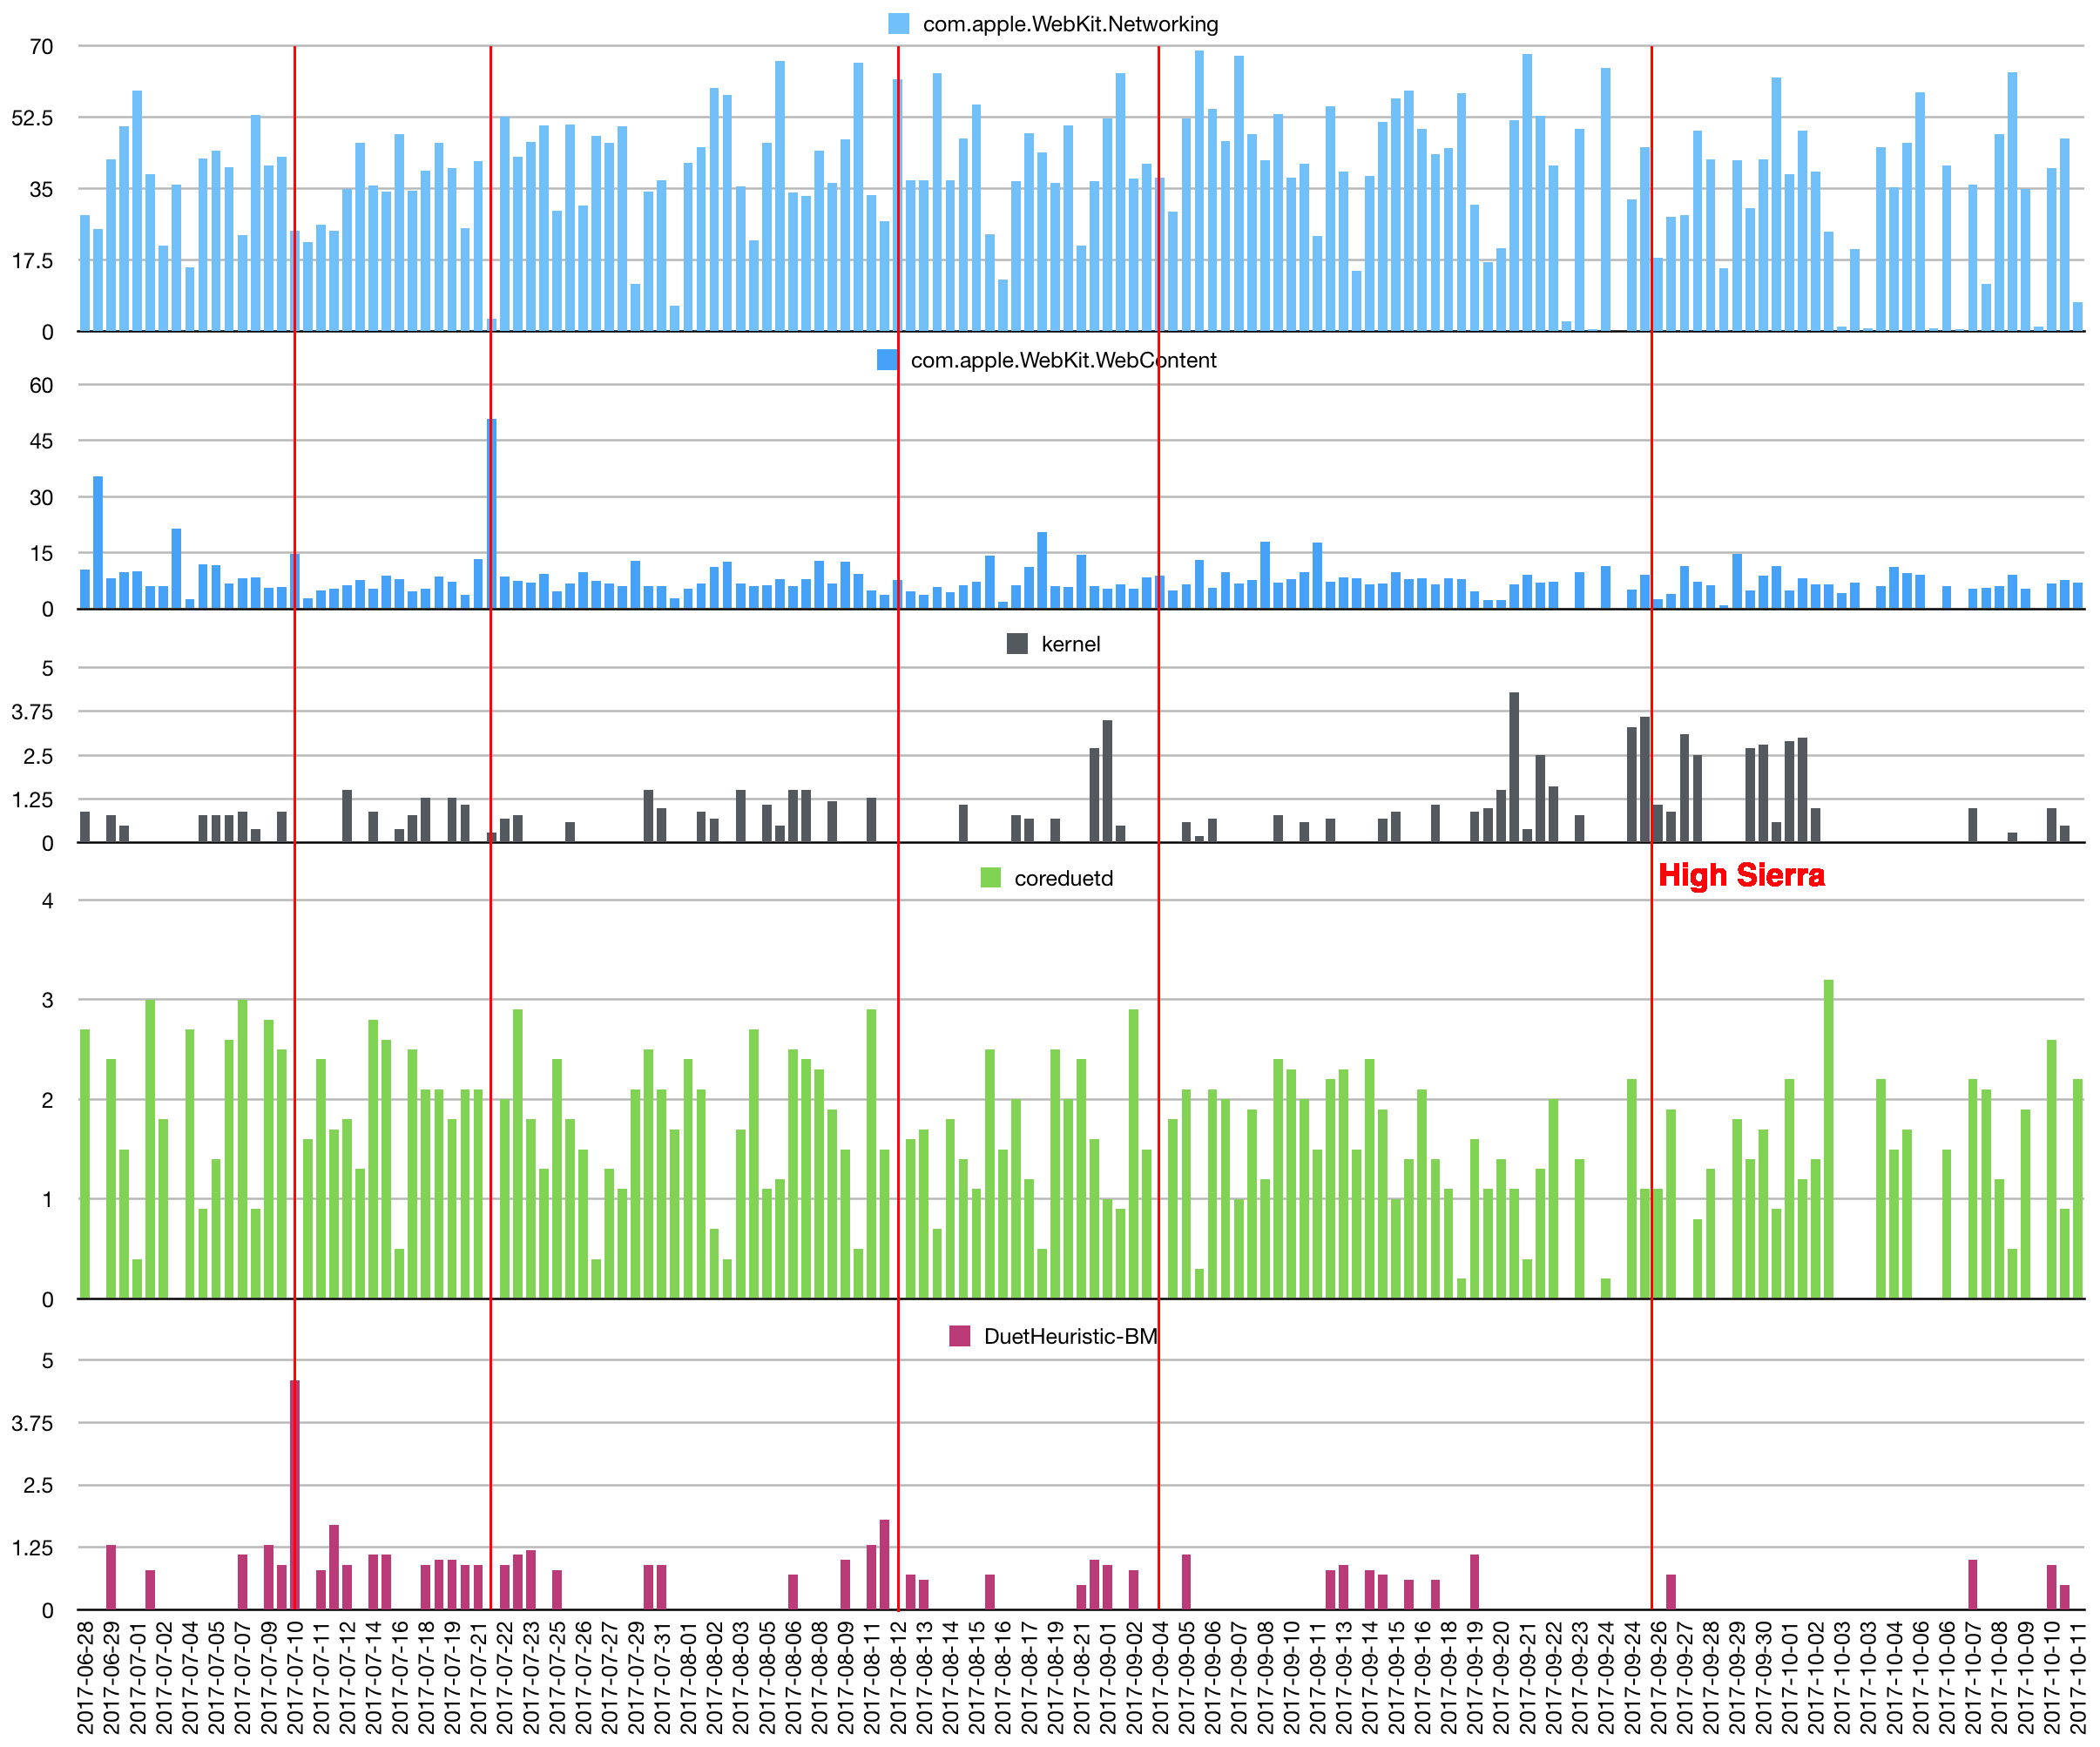
This gives an overview of five macOS processes for the period: the two WebKit components are at the top, the kernel below them, and CoreDuet processes at the bottom. Four of the red line markers show dropouts in coreduetd, and that at the right (labelled) marks the start of my long series of High Sierra downloads and installations.
Three of the four dropouts in coreduetd do appear to be instances of its failure, with no signs of anything untoward happening in WebKit or the kernel. The dropout on 21 July appears different, though, as it coincides with the glitch in WebKit.WebContent, very low WebKit.Networking load, and an exceptionally short log file. It would have been valuable to have looked at that log file in more detail, which would only be possible using a Time Machine backup.
High Sierra brought unusually high kernel log loads, and low loads in coreduetd and DuetHeuristic-BM. These may be accounted for by the fact that these logs exclude periods when this iMac was running High Sierra (collected into its own logs on the external boot disks), and the fact that, when running in Sierra, my iMac was making repeated full Time Machine backups over this period.
Traditional logs are relatively quiet, and a place to look for warnings and errors. When you’re trying to look for one or two events, which might help diagnose or explain a problem or bug, they are excellent tools – if they happen to have captured the right messages at the right time.
Although you can still use the macOS unified log in that same way, with Consolation or the log command to hunt down and explore small numbers of events, the unified log is also a unique platform for looking at statistics and patterns. A traditional log may tell you that an app crashed when trying to display a specific dialog; the unified log could tell you that app was having more generalised problems in handling several of its dialogs, or that a particular framework or service in macOS was in trouble, and why.
The approach that I have used in these two articles, starting from the log summaries in logd‘s log, shows a prototype for a new method of approaching the unified log, from the top down, eventually reaching the level of pooled log entries for specific types of event. To be able to use this, we need radically new tools for working with the macOS log.
