

We don’t always notice something is wrong within a few hours of the event that caused a problem. Sometimes it can take days or weeks before we realise that we need to check something in the log. By that time all trace has vanished, as the active log will have rolled those log entries long before we go looking for them. This article shows how to recover and analyse events from the more distant past, using a Time Machine backup and my free utilities LogUI and Logistician. My target is the macOS 26.3 Tahoe update installed on my Mac mini M4 Pro on 11 February, and I performed this analysis 11 days later, on 22 February.
When was the event?
In this case I remember updating at around 18:30-19:30 on 11 February, but I don’t even need to recall the date. I first copied the logdata.statistics.1.jsonl file from my active log in /var/db/diagnostics to a working folder in ~/Documents, then opened it using Logistician.
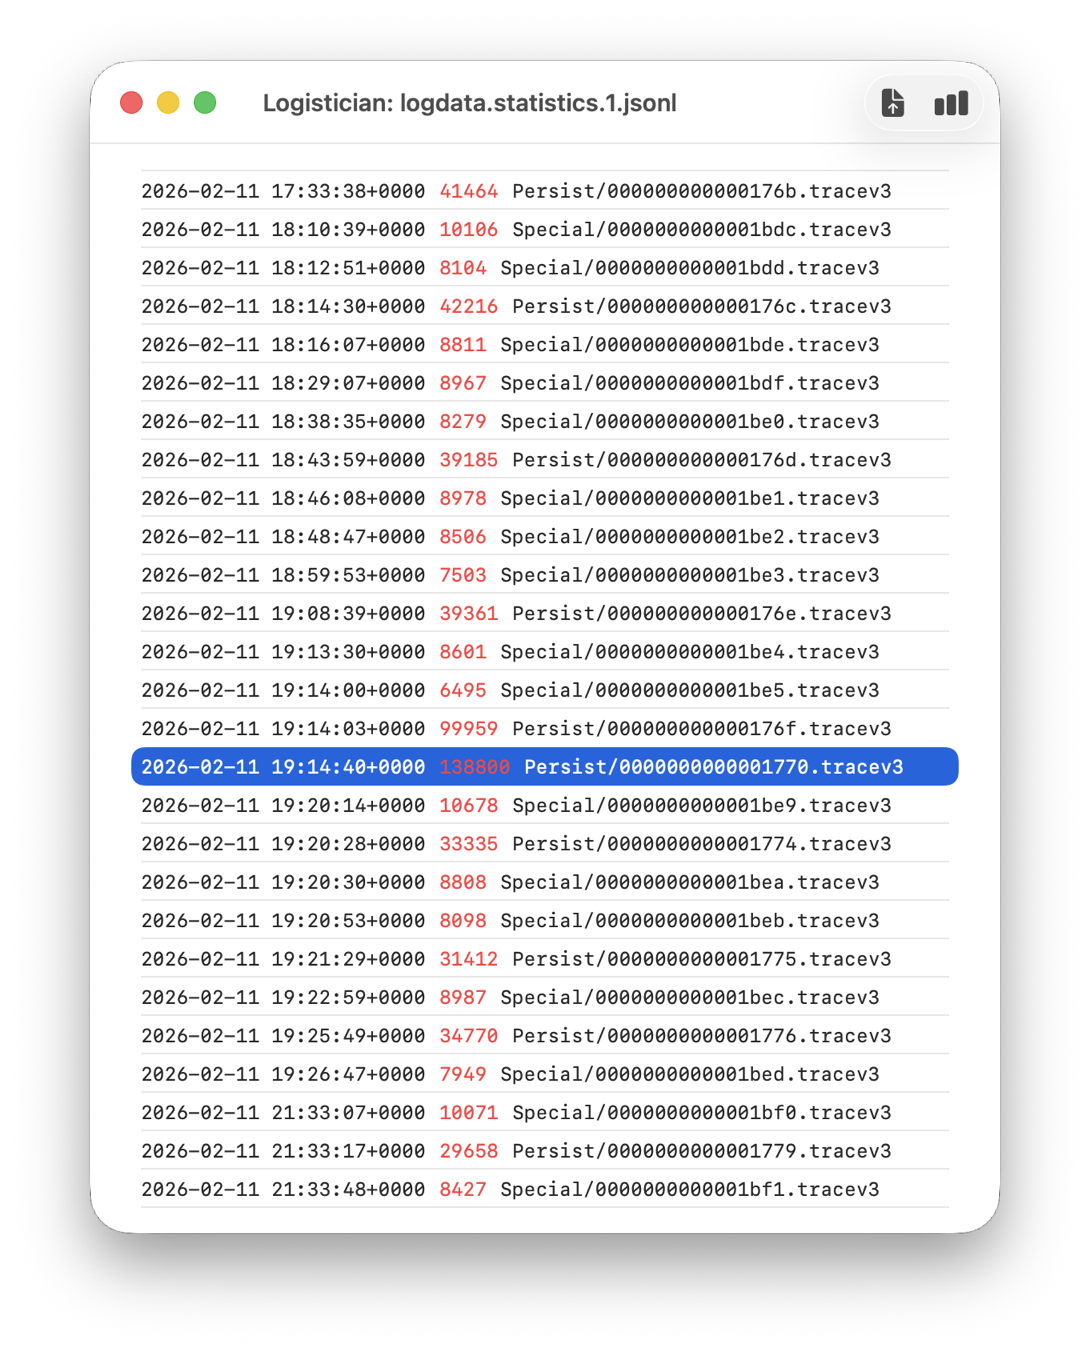
The log file listing between 18:10:39 and 19:26:47 on 11 February 2026 shows a remarkably rapid turnover of log files that’s an obvious marker of that update. Highlighted here is a Persist file that’s exceptionally large at 139 MB of log entries for a collection period of just 37 seconds, although like other tracev3 log files in the Persist folder that only takes 10.5 MB of disk space.
Retrieve the log
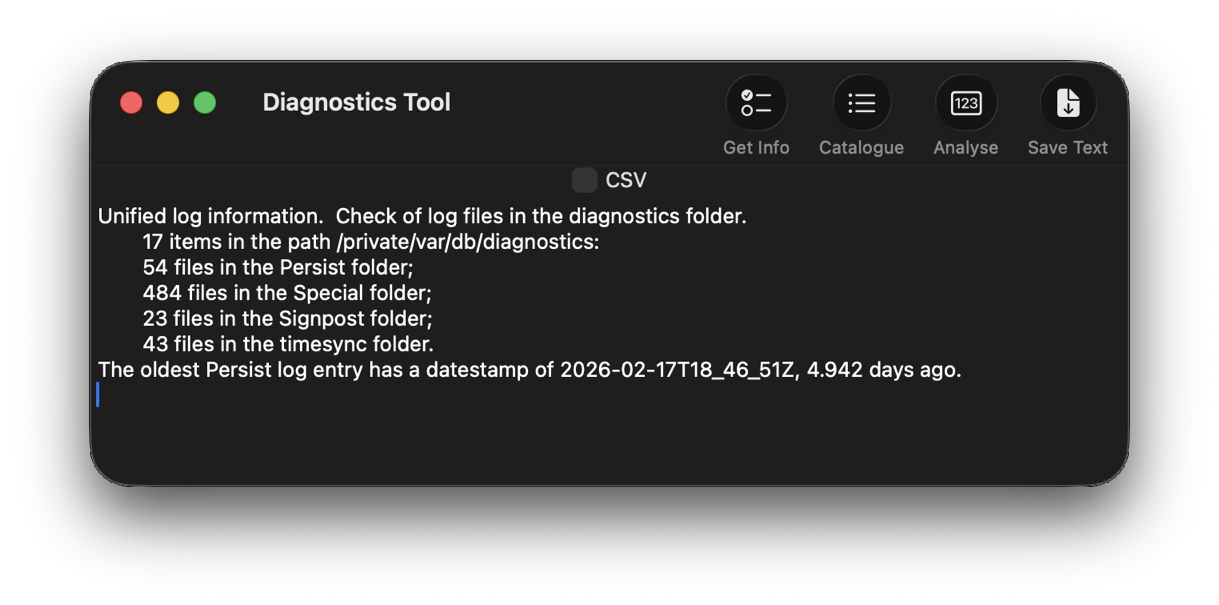
Although I’m confident those logs were removed many days ago, I open LogUI, then select its Diagnostics Tool from the Window menu. I click the Get Info tool and select my active log in /var/db/diagnostics. That tells me that the oldest log entry there dates from 17 February, so there’s no point in trying to find those entries in that log.
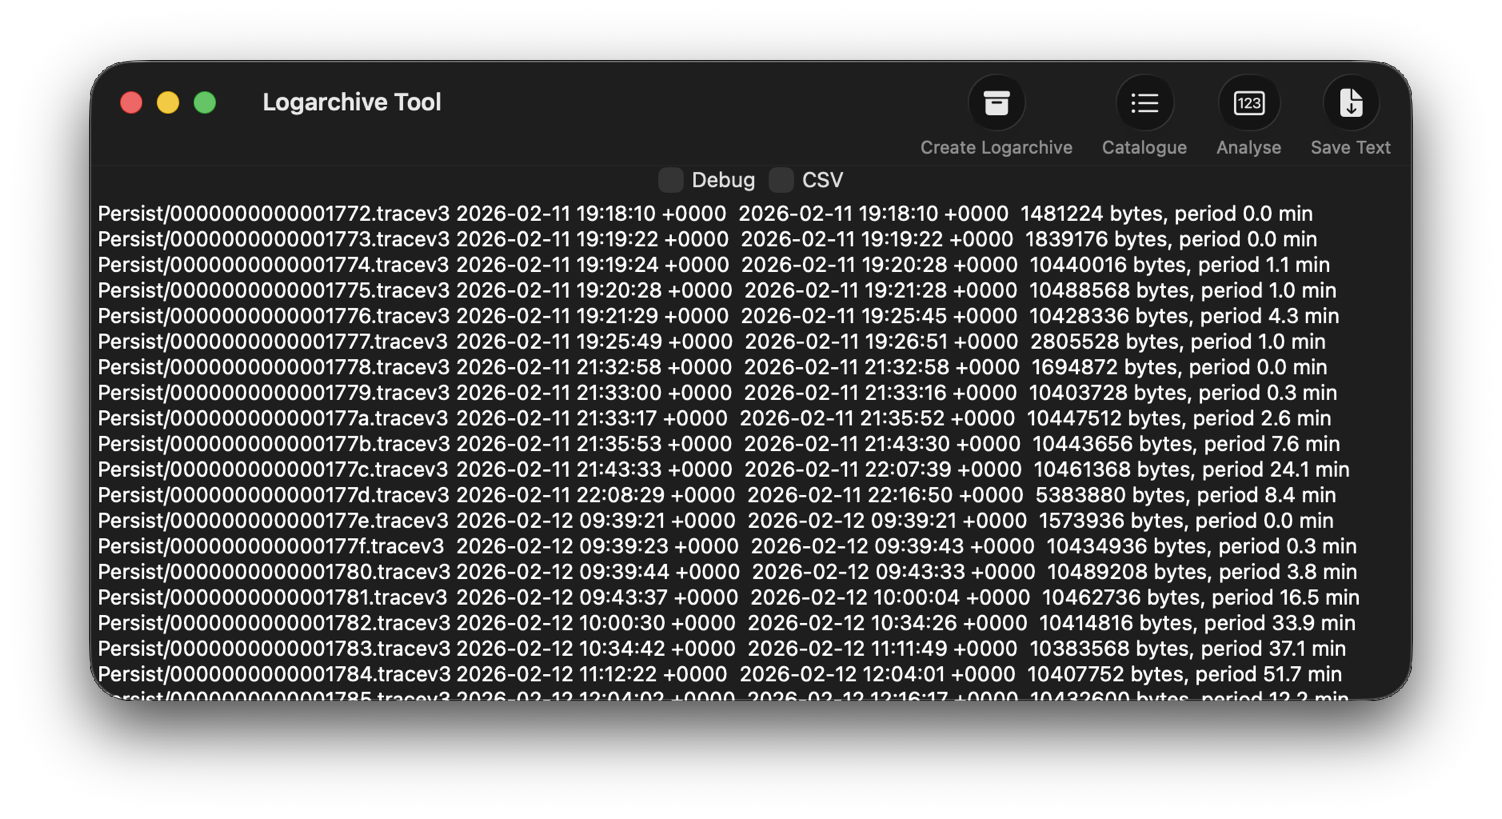
Like all good backup utilities, Time Machine also backs up the whole of the log folders, and I can use those to create a logarchive file for analysis. I therefore locate the next backup made after those log entries were written, on 12 February, and copy the /var/db/diagnostics and /var/db/uuidtext folders into a new folder in my working folder, ready to turn them into a logarchive.
In LogUI, I open its Logarchive Tool from the Window menu and use that to turn those folders into a logarchive I can access using LogUI. I check that freshly created logarchive using the Catalogue tool to confirm that it contains the log files I want to browse.
Identify the event
With the historical log safely preserved in a logarchive and a defined time of interest, my next task is to identify the event I want to investigate. In this case, I could probably go straight ahead and look at all entries for a few seconds, but in other circumstances you may need to know which entries to look for.
Back in Logistician, I select that extraordinary Persist log file and view it in a Chart. Most of the other log files over this period look like this:
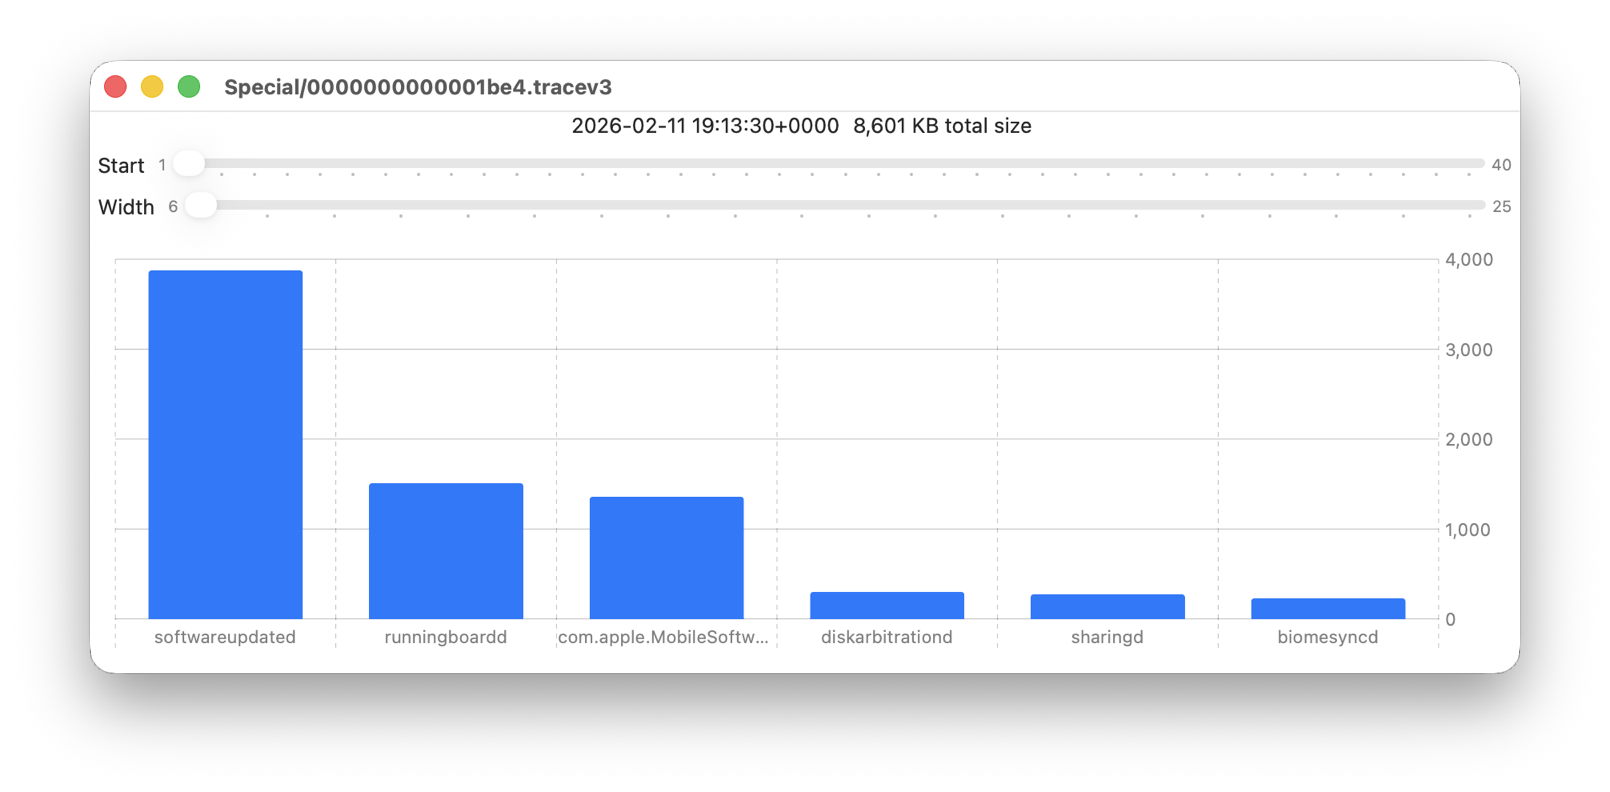
with large quantities of entries from softwareupdated, com.apple.MobileSoftwareUpdate and similar processes. But the huge Persist file that filled in only 37 seconds is exceptional.
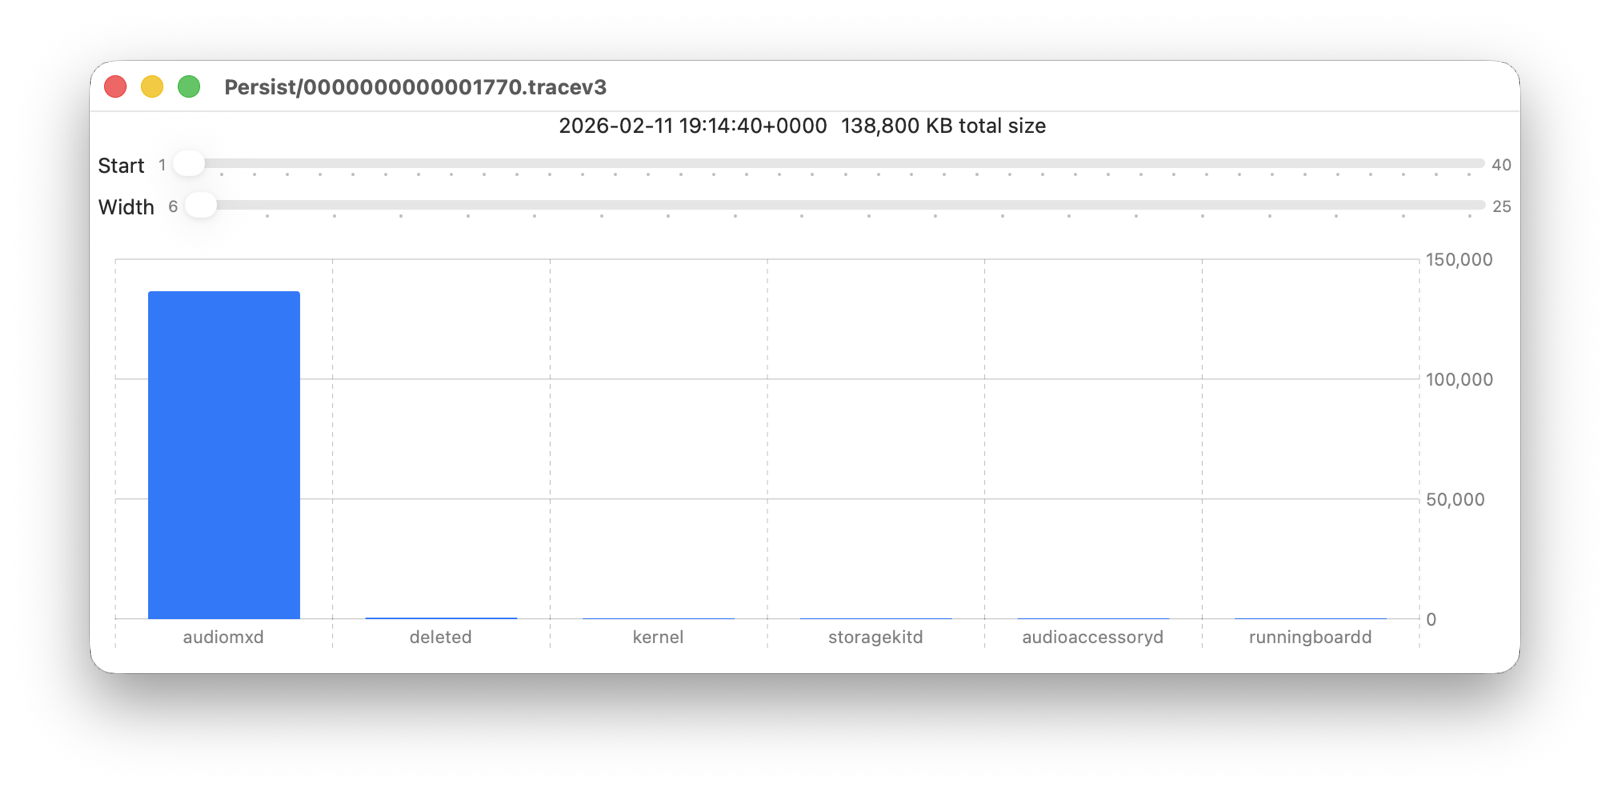
Almost all its entries are from audiomxd, and all other entries are dwarfed by its size.
Browse the event
By default when you click on LogUI’s Get Log tool it will fetch those log entries from the active log. To switch that source to my logarchive file, I click on the Use Logarchive tool and select the logarchive I just created in my Documents folder. To remind me that it’s no longer looking in the active log, that window then displays a red-letter caution of !! Logarchive to the left of the Start control. That also reminds me to use dates and times within the range covered by that logarchive.
I set the Start to ten seconds into the collection period of that large Persist file, a period of 1 second, and the maximum number of entries to 100,000, then click on the Get Log tool.
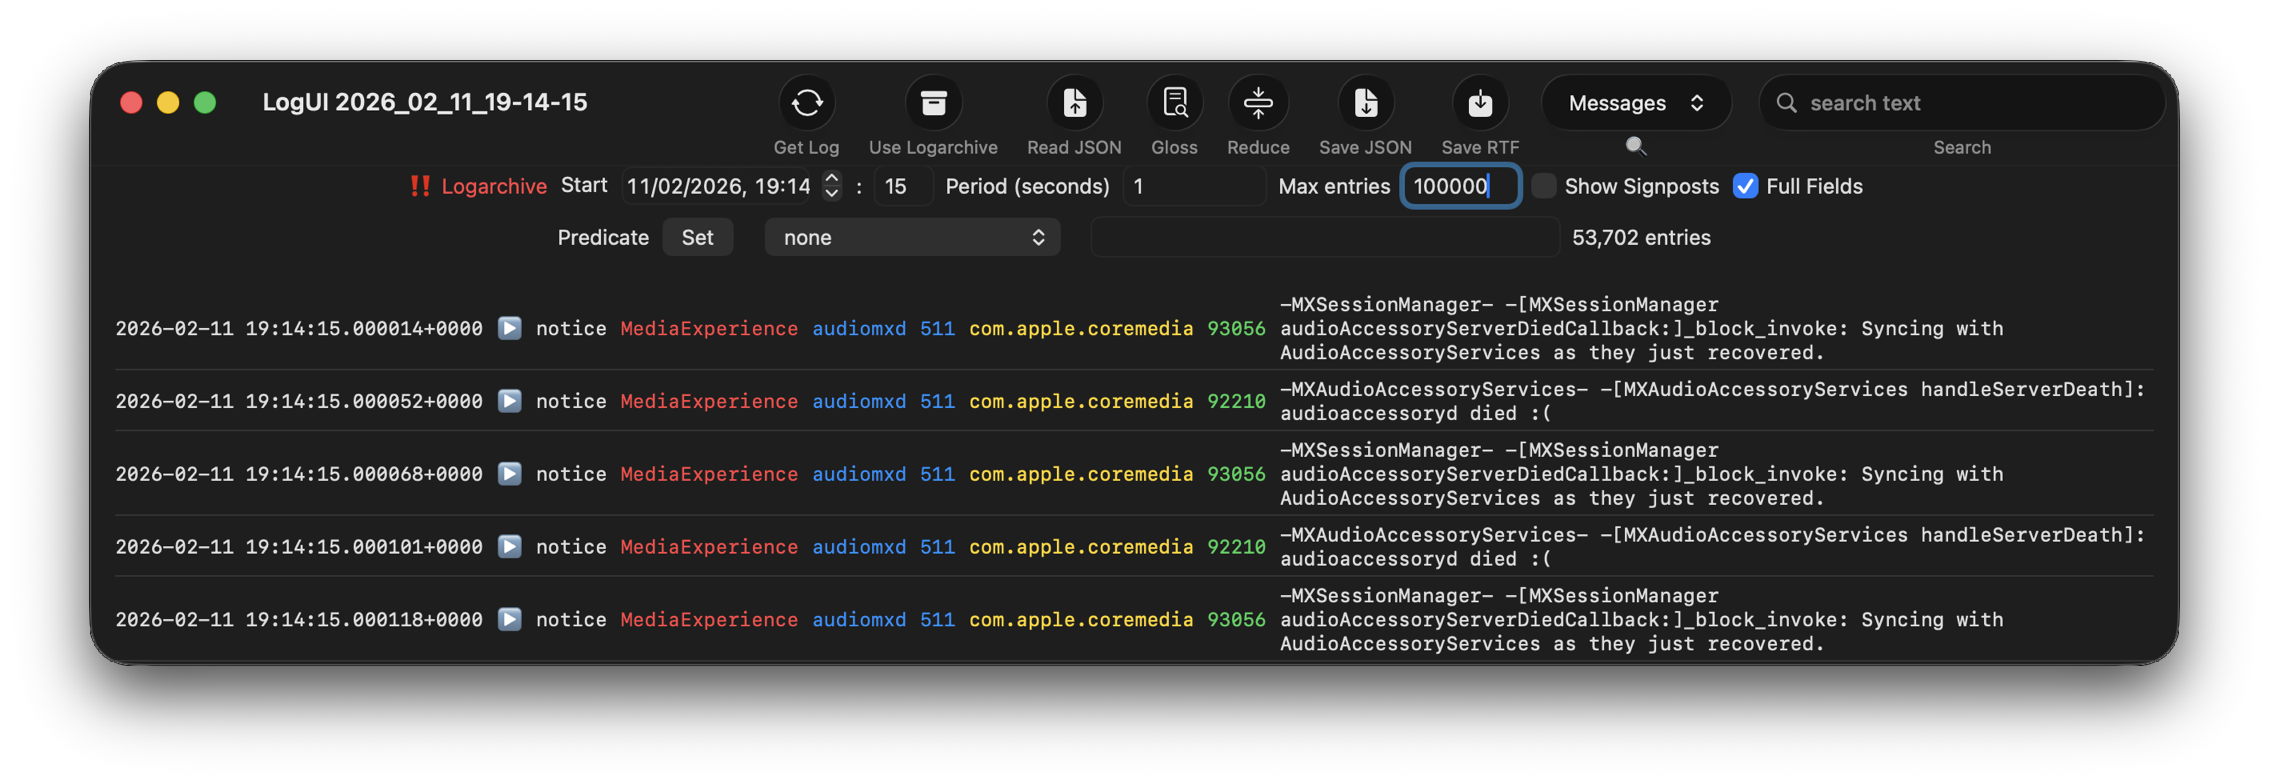
This is one of the most remarkable log extracts I have ever seen: in this 1 second period, the audiomxd process in com.apple.coremedia wrote about 53,000 entries to the log. Over the 37 seconds of log records in that single Persist file, audiomxd must have written at least 1.5 million log entries. These are all apparently the result of the ‘death’ of the AudioAccessory service audioaccessoryd, and its recovery after updating macOS.
Summary
- Identify approximate time of event from /var/db/diagnostics/logdata.statistics.1.jsonl using Logistician.
- Check in LogUI whether that falls within the period of the active log.
- If not, retrieve /var/db/diagnostics and /var/db/uuidtext from the next backup made after the event.
- Convert those folders into a logarchive using LogUI’s Logarchive tool, and check it contains the period of the event.
- Identify the processes involved using Logistician’s chart.
- Set LogUI to use that logarchive, enter the correct date and time, and get log entries for the required processes.
