
One of the first things you want to know about any new processor or chip with processor cores is its performance. Is it faster than equivalent processors made by Intel or AMD, and is an M1 Pro faster than the original M1? Over the last year, I’ve been looking at different ways of measuring this for Apple’s M1 chips, and this article and its sequels summarises some of the lessons so far.
My starting point is running widely used benchmarks in Geekbench 5 on the 8-Core Intel Xeon W processor in my iMac Pro. Here’s what I see in Activity Monitor’s CPU History window for a typical test run.
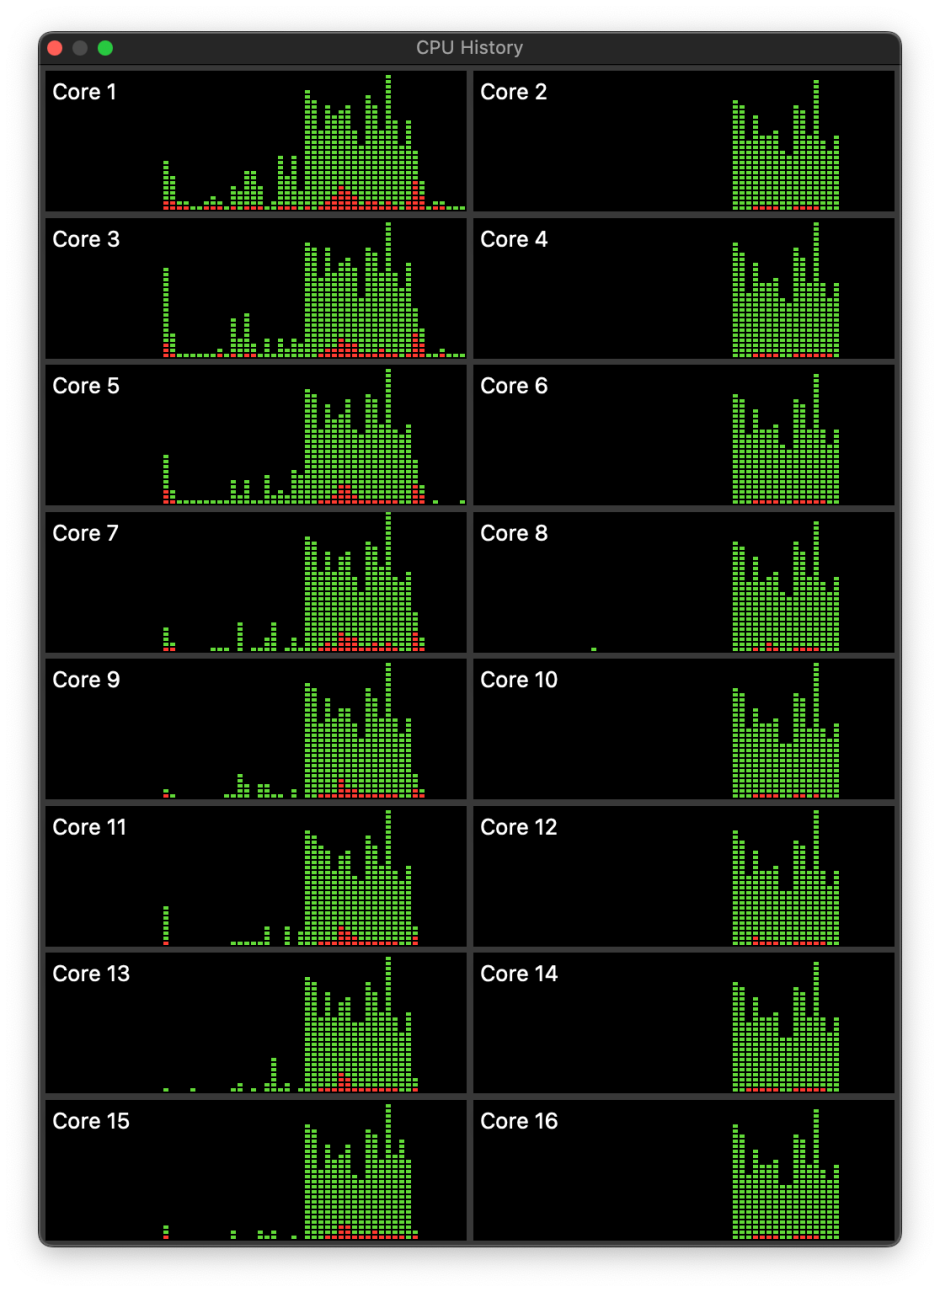
In each of these CPU History windows, time passes from left (oldest) to right (newest) for each of the panels, with red representing system load and green the app load. In this case, Geekbench ‘single core’ tests were run for the period starting about a third of the way across each panel, then the ‘multi-core’ tests cut in just after half way, and are reflected on all the cores, until they complete and load drops to almost zero. Being an Intel CPU, the cores on the left with odd numbers are ‘real’, and those with even numbers on the right are virtual cores achieved in Hyper-Threading.
In fact the ‘single core’ tests are distributed across all eight cores, but look as if their total represents something approaching 100% load on a single core, confirmed by the figure given in Activity Monitor’s main window. The ‘multi-core’ tests only attain 100% briefly on all cores, but average well over 50% throughout, and were sufficient to bring the iMac’s fans up to speed. Load distribution is also fairly even and follows a similar pattern on each core shown.
My conclusion is that the resulting benchmark doesn’t fully assess the capacity of all eight cores, but it’s probably not far off.
When Geekbench 5 runs the same CPU tests on my M1 Mac mini, the picture is quite different.

The single-core tests are run on just two of the Performance (P) cores, where they seldom reach a total of 100% load, but exceed 50% much of the time. While the multi-core tests do load all eight of the cores, they only reach 100% for brief periods at the start and end of the tests, and for much of the time barely reach 50%, although they’re spread evenly, on P and E cores.
Try that on an M1 Pro running on mains power, and the problems are even more apparent.
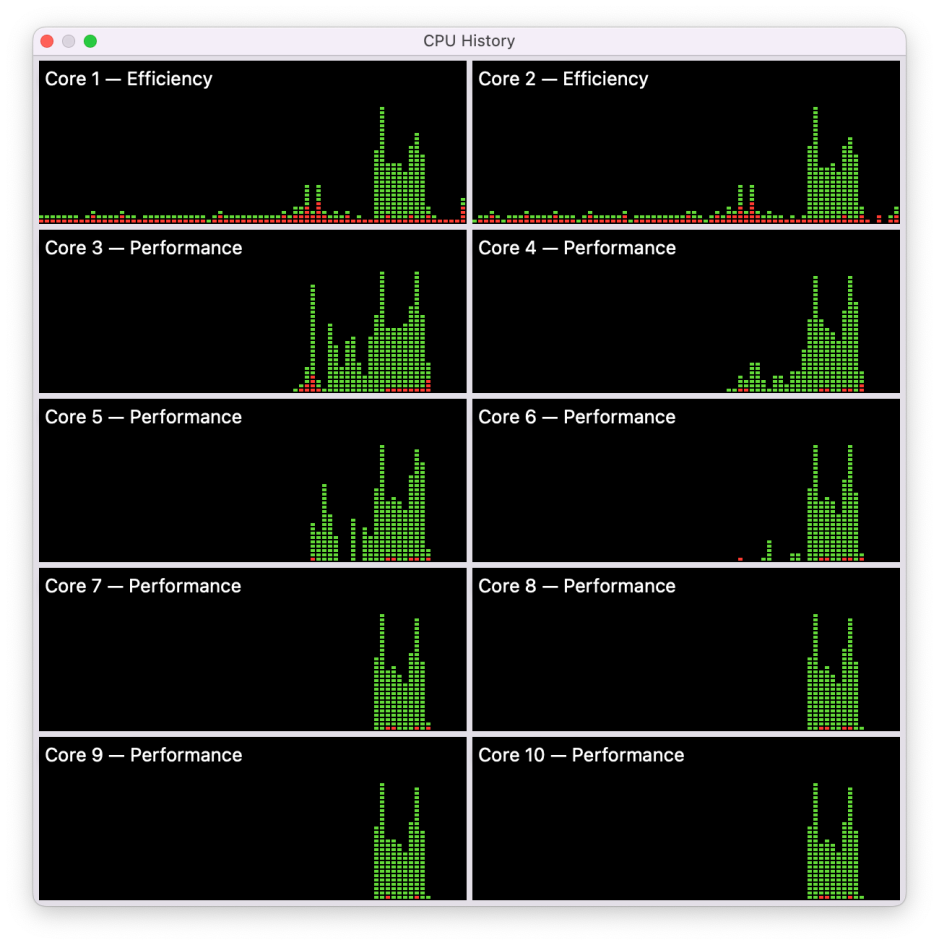
Single-core tests are distributed across the first cluster of four P cores, and probably amount to a total of significantly less than 100%. The multi-core tests, though, never reach 100% on any of the ten cores, and much of the time fall well short of 50%, although they appear similar in pattern and evenly balanced across the cores, including the E cores.
If we expect a CPU benchmark to reflect maximum capacity of the cores to take load, there’s a wide gulf between the results on the Intel Xeon and Apple’s M1 chips. There are, of course, a host of reasons which could account for this, from inefficient code generation for the ARM cores to inaccuracies in Activity Monitor. Unfortunately, it’s extremely hard to assess why this occurs.
Assuming that the Geekbench performance figures are linear, with twice the performance being reflected as twice the figure (as claimed by Primate Labs), one way to get a better idea is to run multiple copies of the tests to reach the target 100% load. When I first tested my M1 Pro, it returned a result of 1772 for single core, and 12548 multi-core even though none of those tests came close to using 100% of any of its cores. When two copies of Geekbench 5 were run at the same time, started within a couple of seconds of one another, the single core score remained unchanged, and the two multi-core scores were 9828 and 8845, a total of 18,673.

During the initial single core tests, total load exceeded 100% across all four cores in the first cluster. When the multi-core tests were running, 100% was reached for substantial periods at the start and end of that phase, and in between load was well over 50%.
The final test in this series was to run three copies of Geekbench simultaneously, which returned single core scores of 1682-1717, only slightly lower than for a single run, and multi-core scores of 7162, 7061 and 6428, totalling 20,651.

The CPU history shows much fuller load on the cores during the multi-core testing, although even then load wasn’t sustained at 100% throughout.
This isn’t a claim that the Geekbench score for an M1 Pro should be raised to over 20,000, but it suggests that, if these benchmarks were able to make fuller use of the cores in the M1 Pro, they’d be more likely to deliver a score of over 18,000. That relies on such high loading being possible, which also needs demonstration.

My last CPU History for today doesn’t rely on Geekbench, but on some test loads which I’ve been developing in my own app AsmAttic. Each of these tests is a mixed benchmark consisting of integer and floating point operations run millions of times in a tight loop. For the first half of this chart, the P cores were loaded with one copy of the task, which was run fairly evenly across the four cores in the first cluster, with the E cores and the second cluster of P cores largely inactive.
Just after half way, when the P cores had completed that initial task, the two E cores were loaded successively with two copies of the same iterative task, so that with both copies running they reached 100% load. Towards the end of that, I loaded the P cores with multiple copies of the same task, bringing the first cluster to 100%. In the final phase, I loaded eight copies of the same task onto the P cores, and managed then to achieve 100% load across all the cores in both clusters. Not only is it possible to attain 100% core loads using these synthetic tasks, but this can also be seen in real-world apps, for instance when using AppleArchive for compression.
What’s also interesting here is that, despite the great variation in loading of the cores, when run on the P cores 10^8 iterations of the test took 14.2 to 18.9 seconds, quite a tight range considering the differences in total core load during execution.
My next step is to use synthetic loads to compare different M1 chips, and different conditions, including power options, which I’ll describe in the next article.
