

Performance is important to everything we do on Macs. Hanging around waiting for a script to finish, or an app to do its job, is a waste of our time. Yet measuring performance isn’t easy: almost anything you do to save performance information is going to alter that performance, and the more you measure, the harder it gets to harvest and analyse.
This is where Signposts in the unified log come in, provided of course that you’re developing software within Xcode and know how to use its Instruments feature. That rules out a lot of major languages such as Python, AppleScript and shell scripts too.
RouteMap is an app which opens precision performance analysis to almost any scripting or development environment. If yours doesn’t support writing Signposts to the log, you can use my free command tool blowhole, which not only writes regular log entries, but Signposts too.
To get an idea of what RouteMap does, you don’t have to write a line of code. macOS, even its release versions, writes ample Signposts which you can analyse and study. The great majority are concerned with graphics performance, but you’ll find Catalina telling you how long various steps took when opening an app, including the time required to satisfy Gatekeeper’s checks. In beta-releases, Signpost entries can be even more copious and revealing.
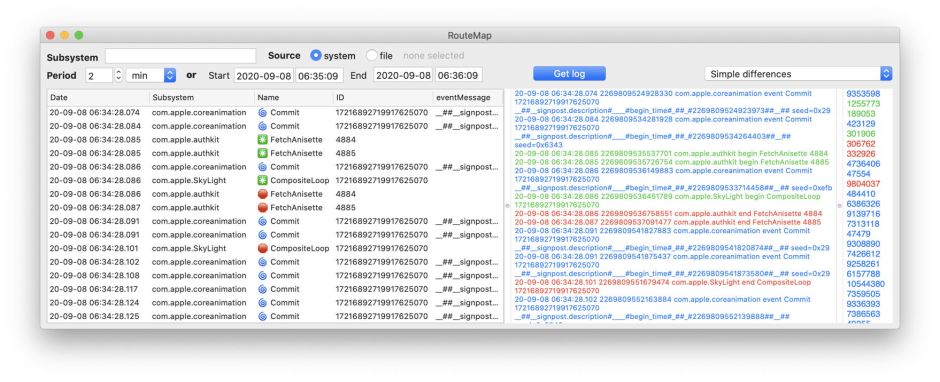
RouteMap’s window shows three different views on the same log excerpt: at the left, each Signpost entry is listed in a Table, with coloured emoji used to indicate those which mark the start of an operation (green) and its end (red), and individual Signpost events (blue). The central view is a regular log listing, so you can see the most important fields in those log entries.
At the right is its numeric analysis: set according to the popup menu above; in this instance the app is showing the times in nanoseconds between successive Signposts. That’s useful when those are all events, but not when they’re begin-end pairs.
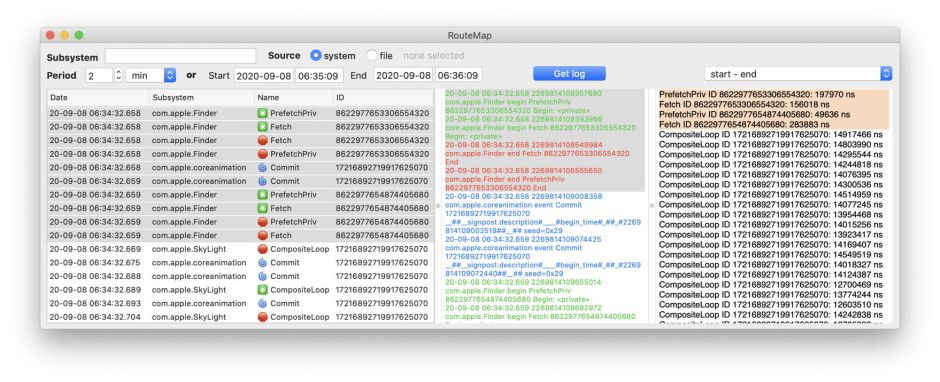
Change the setting in that popup to calculate the time difference between begin-end pairs, and RouteMap matches each begin Signpost with its end, and shows the differences. Here it’s caught Prefetch and Fetch actions in the Finder. You’ll see similar pairs for different steps in application launch, which can be used to measure how long LaunchServices and other systems take to launch apps in different situations.
The major advance for this new version of RouteMap, in addition to supporting Big Sur and running native on both Intel and Apple Silicon Macs, is that it now takes account of the Mach precision clock timebase on that Mac. This ensures that its time differences are correct even when run on Apple Silicon systems. Previous versions of RouteMap only generate accurate times when running on Intel Macs.
To help you implement Signposts in your own apps, I’ve written a simple demo app named Whither, which is available in full Swift source code. RouteMap, blowhole, Whither and its source code, and a guide to using Signposts, are also provided in a complete Signpost Kit, which is ideal for anyone wanting to get started with using Signposts from their own apps and scripts.
RouteMap version 1.0b4 is now available from here: routemap10b4
from Downloads above, and from its Product Page.
The Signpost Kit version 3 is now available from here: signpostkit3
from Downloads above, and from its Product Page.
Tomorrow, using these tools, I’ll take a look at measuring log latency, an essential topic for anyone who does anything with the unified log, particularly performance measurements.
