
Computers don’t seem very good at distinguishing the important from the unimportant, and the unified log in macOS is a good example. There are only a few really significant events in normal Mac use, including starting up, and changing between sleep and wake states. They’re each high-risk events, which are common occasions for faults, crashes, even kernel panics, yet they’re devilishly difficult to find among hundreds of thousands of log entries.
My new version of Woodpile can do this for you: it has a checkbox which results in each startup and wake from sleep being marked by a red cursor line in the chart view.

For example, here’s a view of kernel log messages during a whole day. There are five events marked, each waking up from sleep. Although the first three seem to have passed uneventfully, with few messages from the kernel, the final two appear different, being associated with high log load for the kernel.
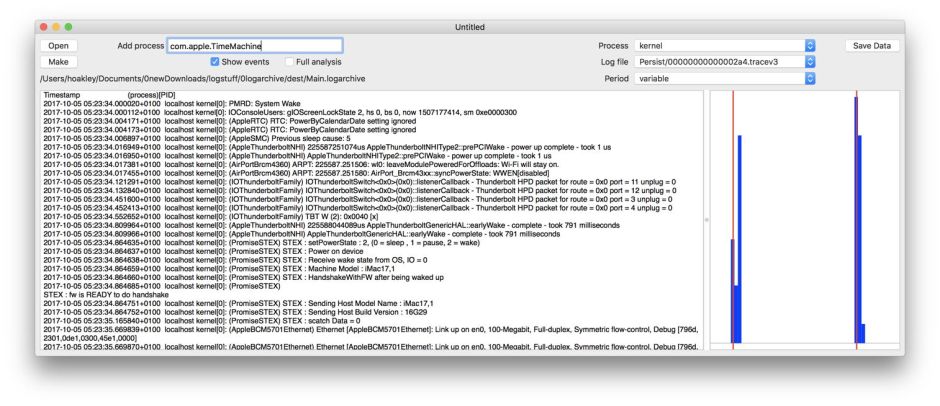
Clicking on the bar in which they both occurred, with the Command key held, I can see instantly the log messages entered by the kernel for those two events, can read the ‘previous sleep cause’, and look for problems and errors.
The other major improvement in this new version is the ability to compile an overview of log activity for processes which don’t appear in the standard Process popup menu.
Woodpile works with logarchives, within which are logs maintained by logd, the macOS log maintenance daemon. In those, every log file which is saved is analysed for the processes which have contributed most to that section of the log; Woodpile uses those figures to populate the chart view, and those processes for the Process menu.
Although those standard processes are the most valuable for this type of log analysis, there are many important processes which are normally excluded. For example, Time Machine normally only makes a dozen or so log entries every hour, when it runs automatic backups. Even if it’s in trouble, it is very unlikely to appear in the statistical analyses generated by logd.
If you add com.apple.TimeMachine as a custom process to Woodpile’s Process menu, previous versions only displayed charts for individual log files – as logd didn’t provide any useful data. This new version offers an option for Full analysis, which will show the number of entries in the logs made by a custom process over the last twenty days or so for which there are full log files available.

If you want to see this information, enable Full analysis using its checkbox, set the Process menu to your custom process, and the Log file menu to the all option.
Woodpile will then take several minutes to generate the data. This is because the only way to achieve that is to check each of the fifty or more log files included in the logarchive, using the log show command to inspect them one by one. If you need this information, though, it is well worth the wait: no other log tool can produce this type of analysis over a period of around twenty days. In this case, it shows how some log files have few or no entries from Time Machine, indicating that it had stopped working over those periods.
There is a new popup menu labelled Period: currently that is not functional, but in the next version I hope to use it so that you can set two or more windows to use the same times and periods, to make it easier to compare different processes.
This new version of Woodpile, complete with eighteen pages of detailed notes, is available here: woodpile10b1
and from Downloads above.
