
A couple of months ago, I showed here an exploration of events which occur after Sierra starts up, using Consolation 2 as a log browser. This article revisits startup using the same logarchive, using the new features in Consolation 3.
Work from a logarchive
Last time, I made a logarchive of the three minutes or so around a restart. This is easy to do as follows:
- A couple of minutes after startup, open Consolation 3.
- Set the period to 3 or 4 minutes so that you capture 30 seconds or so before a restart (if restarting).
- Click on the Write logarchive button and save that excerpt as a logarchive.
As I did that for the previous article, I work from that same logarchive (from Sierra 10.12.5). To set a logarchive as the target for Consolation, click on the file radio button at the top, for the Log source, and select the logarchive to be used.
Identifying the section of interest
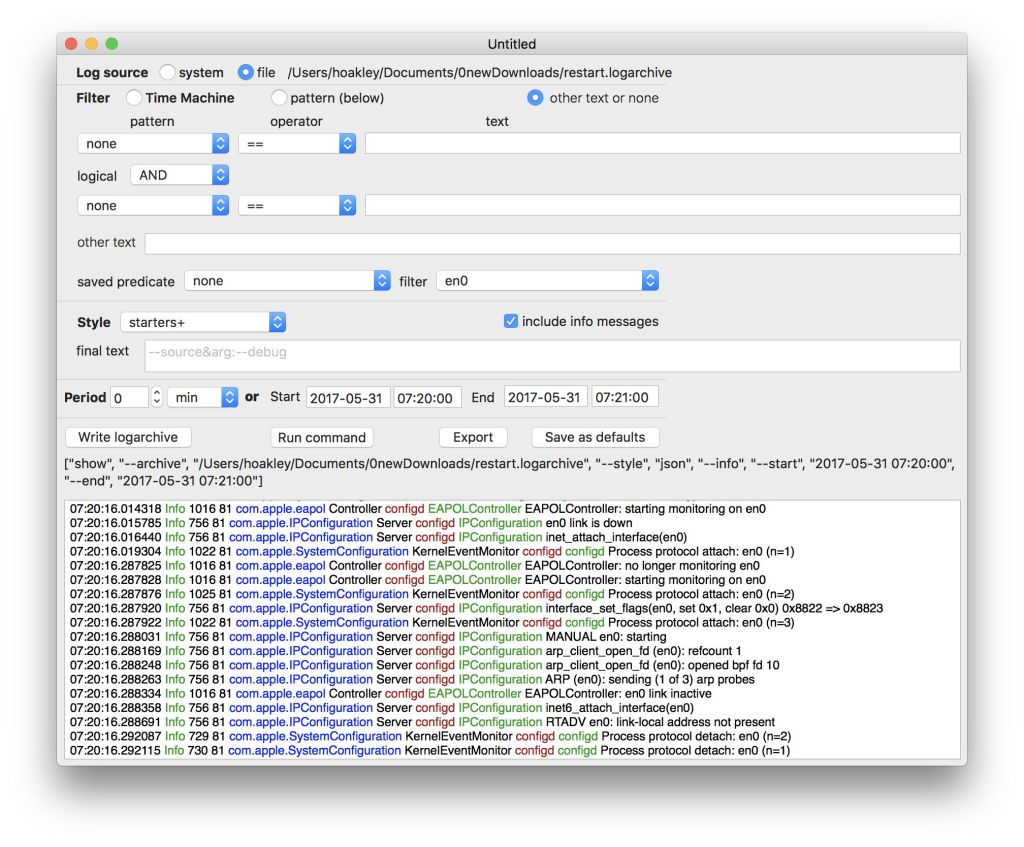
The first step is to identify the very beginning of the startup process. The easiest way to do this is to load the whole log in syslog format and search for the entry containing the text
system boot:
which is the first log entry after startup. Set the Filter to other text, leave the other text box blank, the saved predicate to none, and the style to syslog. Increment the Period to at least the number of minutes of log which you captured, and display the whole excerpt by clicking on the Run command button.
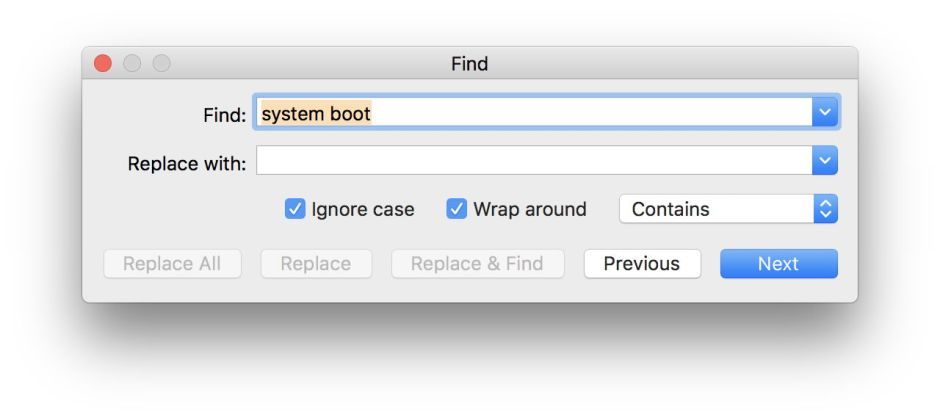
Click in the log output in the lower pane of the window, and use the Find… command in the File menu to search for system boot. Copy and paste the date and time of that entry, less a few seconds, perhaps, into the Start boxes in the Period section. Scroll down to see what sort of period you captured, and set the End date and time to a couple of minutes after the Start, within the period which you captured. Then take the Period in minutes back to 0 (zero), so that future extracts will be based on the Start and End times rather than the whole period.
Setting up defaults and tools
Once you have got those settings in your window, Save as defaults, so that they will be used in all new windows opened in Consolation. This spares you having to keep setting those up.
Then open the Preferences sheet through its command in the app menu.
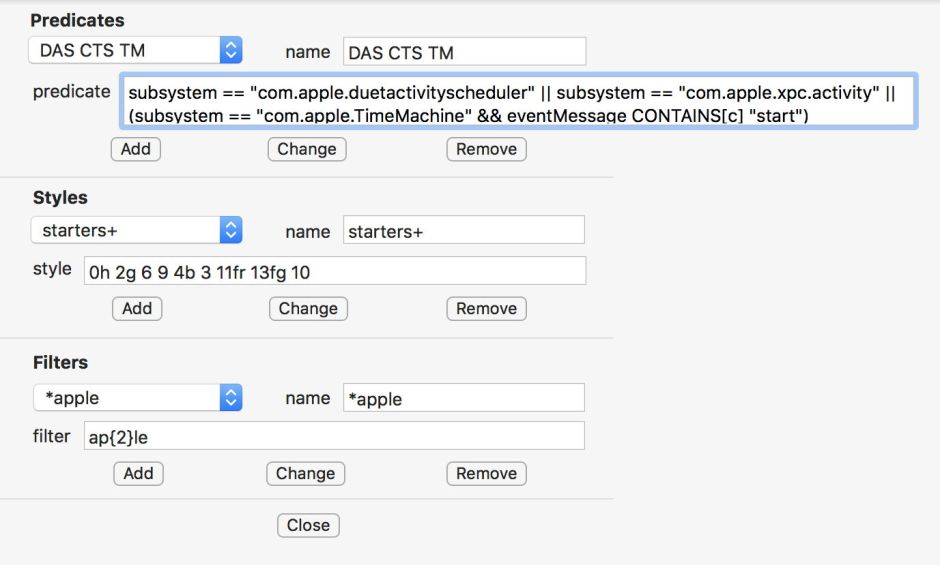
In this example, we’re not going to use any custom predicates, but several custom styles and filters. A good and generally-useful first style is basic:
0h 5r 10
Add that by selecting the New item in the Styles popup menu, and typing basic as the name, and that text as the style; then click on the Add button. Do the same for some other generally useful styles:
basic+ : 0h 4r 6g 9b 10

starters+ : 0h 2g 6 9 4b 3 11fr 13fg 10

starters : 0h 2 6 9 4 3 11f 13f 10
Some useful filters to have here are:
error : error

kernel : kernel

en0 : en0
which are all simple case-insensitive text filters, added using the same method with the Filters popup menu.
Add any other styles and filters which might be of use, then click Close to save those new tools.
In the current beta of Consolation 3, to use those new tools you must close the current window and open a new one. Ensure that it is set up correctly, as you saved as defaults, then get your first properly focussed log extract. For this:
- Log source is set to your logarchive file.
- Filter is set to other text or none, with saved predicate set to none, and filter set to none.
- Set Style to your new basic style, with include info messages ticked/checked.
- The Period is set to 0 min, with the Start and End dates and times set as above, appropriate to your extract.
This may seem fiddly at first, but you are likely to set these up only once for each excursion into a log extract. Once ready, click on the Run command, which will fetch a full extract running between the Start and End times, capturing the first minute or two after startup. It is worth using a basic style which shows few fields at this stage, as there are many log entries. Using a more complex style with many fields shown will make each step slower, because of the volume of log entries which have to be processed.
Exploring in style and filters
The first time that you Run command after setting a style and filter, Consolation 3 has to fetch a full log extract on which to work; this is indicated by the button to the right of Run command changing from N/A to Export – which shows that Consolation has now loaded a JSON dictionary containing the log extract (also reflected in the command arguments shown below).
In Consolation 2, if you wanted to filter by applying a predicate, each time that you changed the predicate, you’d have to click on Run command and wait for another log extract to be fetched.
Now in Consolation 3, the app uses the same JSON data already obtained from the log whenever you change the style or filter, so long as you do not go back to a standard style setting, syslog or default.
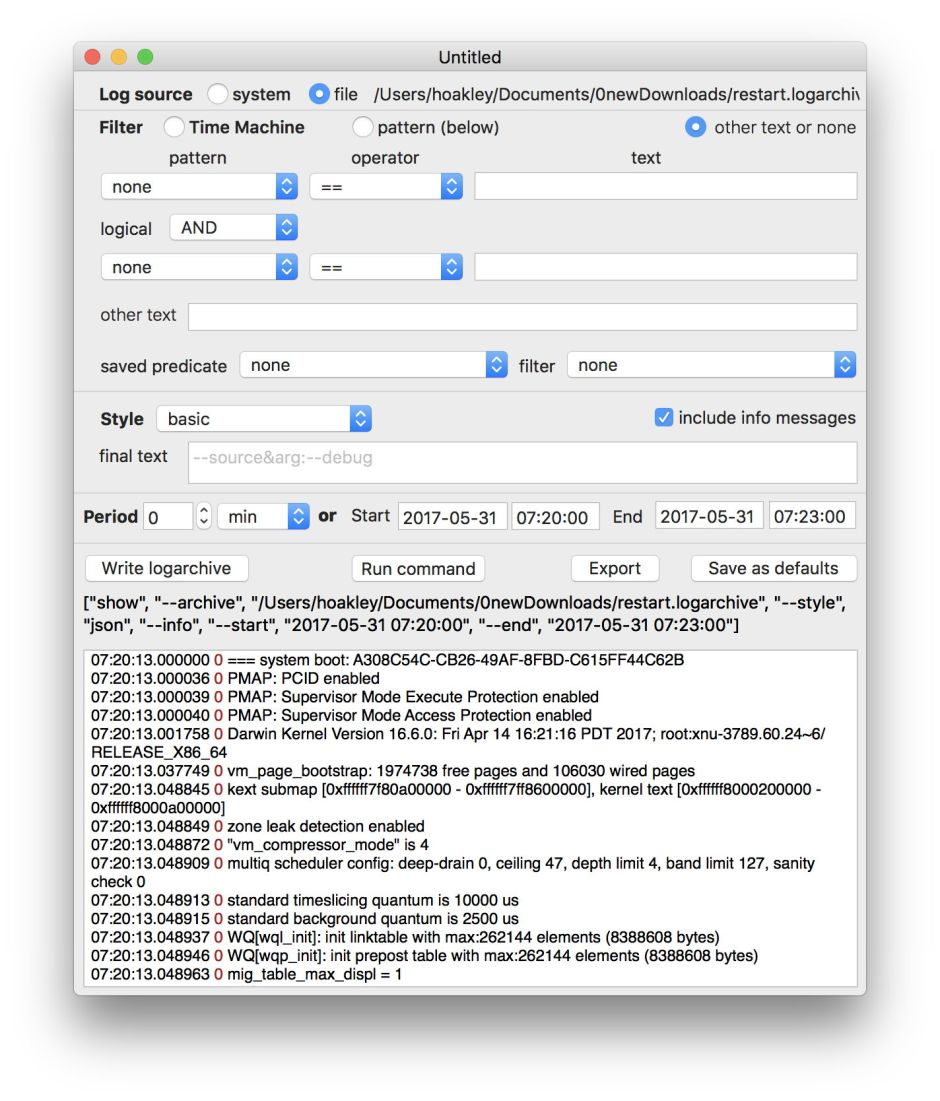
The current settings, with the basic style and no filter, show all log entries in a brief and clean format. At the top you should see the system boot message, following which is a series of messages from process 0, the kernel. To identify other process IDs, open Activity Monitor and sort by Process ID.
Scroll down, watching the red Process ID until it changes from 0 to a number around 100, as other processes are started up. Try changing the style to a more complex one with more fields shown, such as starters+. Because you’ve got a lot of messages on display, this will take a few seconds to complete, but then provides full details for each log entry.
It’s much quicker to switch to a more complex style when there are fewer messages shown. For example, filtering on error or kernel should greatly reduce the amount of text in the log display, and changes in style are almost instantaneous.
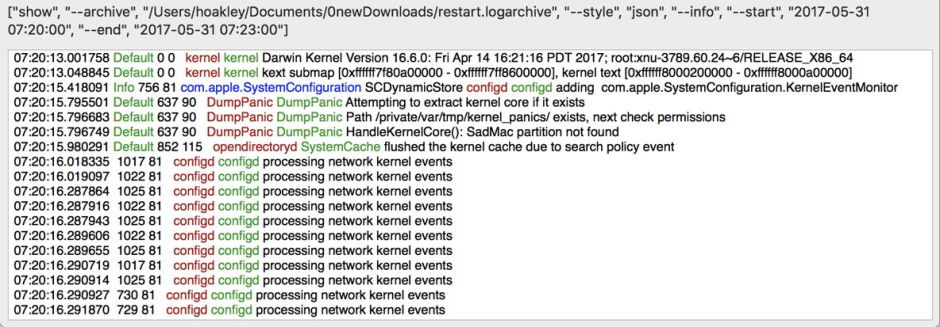
Set the filter to kernel, and the style to starters+, to view in detail entries which contain the word kernel in the message. Towards the top of that view, you should see three successive messages from DumpPanic – easily spotted as that appears in both red and green – concerning kernel panics. If the last shutdown was the result of a kernel panic, those messages should detail the system putting a kernel panic dump ready. In this case, you should see something like
07:20:15.795501 Default 637 90   DumpPanic DumpPanic Attempting to extract kernel core if it exists

07:20:15.796683 Default 637 90   DumpPanic DumpPanic Path /private/var/tmp/kernel_panics/ exists, next check permissions

07:20:15.796749 Default 637 90   DumpPanic DumpPanic HandleKernelCore(): SadMac partition not found
which shows that shutdown was orderly, not forced.
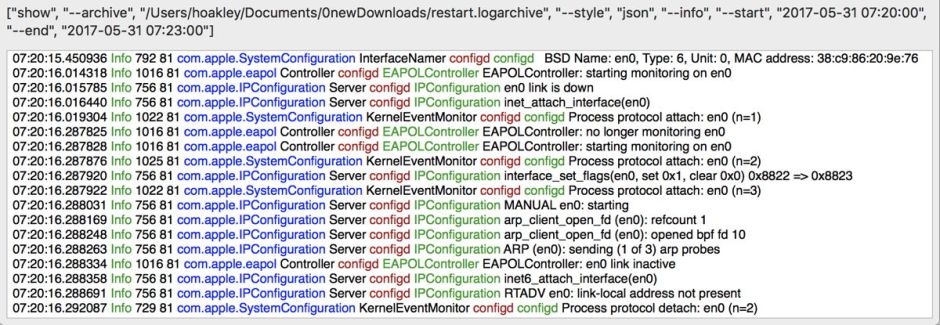
Keeping the same style, change the filter to en0, which looks at the setting up of wired Ethernet connections. Those entries should be displayed almost immediately. You can now follow all the log entries which relate to the en0 network interface, from its initial naming by configd, through its startup, and into mDNSResponder.
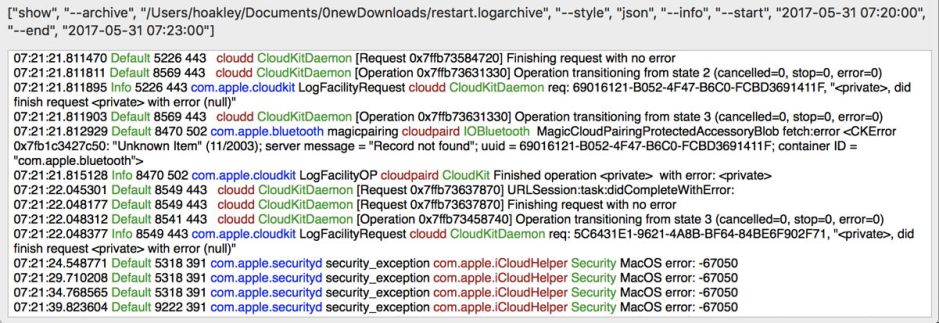
error is another valuable filter term, which will show a succession of errors and their codes. These tend to occur in batches as individual systems are started up. As you browse those, you’ll notice a lot with error codes which are undocumented, and some which are in fact no error. You could filter those out using a regular expression, if you wanted to, or limit the messages to those with error codes of certain ranges.
Finishing with a logarchive
When you have finished exploring that startup, it’s worth asking yourself how you want your default settings to look the next time that you open Consolation. If you’re happy as they are, simply quit. I like to set Consolation’s controls back to using the regular live system log, with a period of a minute or less. Then when I forget to change those the next time, Consolation doesn’t tell me that it couldn’t run the log show command because the logarchive was missing. Remember to Save as defaults before quitting the app.
Looking at specific systems
This has been a general exploration of startup, and has not, for example, examined particular systems or mechanisms like XPC in any detail. When you want to hone in on those systems, you will probably find it best to write a couple of custom predicates to limit the size of the log extract, and allow you to cover longer periods of time. I’ll look in more detail at custom predicates in another article.
