
It’s a bit of a fiddle, and its fairly ugly, but I have now found a route by which you can convert JSON data extracted from Sierra’s logs into spreadsheet formats.
R is a uniquely powerful and extensive data processing and statistics app and language, which is completely free, and supported by a huge range of extension packages. Among them are functions to import (and export) data in JSON format, and Microsoft Excel’s XLSX format. Using other packages, it seems able to read and write data in almost any other documented format too, making it an ideal platform when you need to perform such conversions.
The plan was to import the JSON data saved from Consolation, then export it in XLSX. It almost works, but there is a messy kludge in the middle, for the moment.
There is one small piece of preparatory work to perform: currently (and this will change in the next beta release of Consolation 2), the last line in the JSON output contains the datestamp and the effective log show command. You must delete that whole line using a text editor, as it is not valid JSON and will cause errors when you try to process the JSON data.
If you haven’t already got the current version of R, download it from CRAN (which may offer you a more local mirror), and install it. Locate its app front end, R.app, in the Applications folder, and open that.
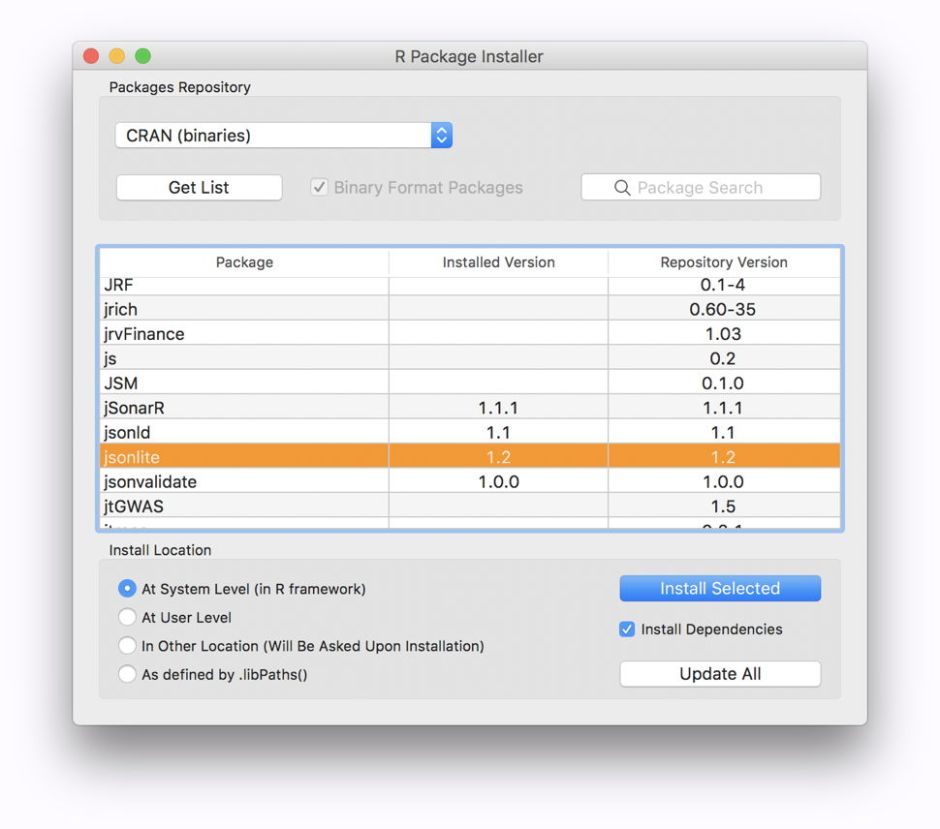
From within R.app, open the Package Installer from the Packages & Data menu. Ensure that it is set to CRAN (binaries), and click on the Get List button to obtain the list of all available packages. From within that list, locate jsonlite, check the Install Dependencies box, and then click on the Install Selected button.
To obtain the xlsx package, repeat that process with that line selected in the list of available packages. You will also see some of the other import/export packages available, such as for XML, which you may wish to examine if exporting to those formats might be useful to you.

These make the packages available; the next step is required to load them. From the same Packages & Data menu, open the Package Manager, click the Refresh List button, locate the jsonlite and xlsx items, and check the box by each to load those packages. You may notice that when a package is selected here, the lower panel of the Package Manager displays helpful information about that package. Text which is rendered in blue will link you to help information, PDFs, and more which detail the package and its use.
In the Misc menu, change the working directory to that containing your JSON data file. This saves you from the tedium of typing longer path names.
At R’s command line, enter the following command
data1 <- read_json("logruns.json", flatten = TRUE)
where the item in double quotation marks “” is the name of your JSON file from Consolation.
This imports the data and converts it into an R list as the variable data1. It may be possible to massage this (or to tweak the import command) to save some of the messier steps later, but I have not discovered any way to do that yet.
Then, to export that data in XLSX format, type in the command
write.xlsx(data1, "logruns.xlsx")
where the item in double quotation marks “” is the name of your export file.
Open this using Microsoft Excel (not Numbers, which cannot cope with its extreme width), and you will see that the data occupies only two rows, the first containing the column headers repeated for each log entry, and the second the data that you want.
Export this from Excel in CSV format, then open the CSV file using a text editor such as BBEdit. Here, truncate the first line to delete all the superfluous column headers, leaving just the first complete set. Then work through the second row, splitting it into the rows of data, one line for each log entry. You may well be able to use a script to automate this, depending on your text editor.

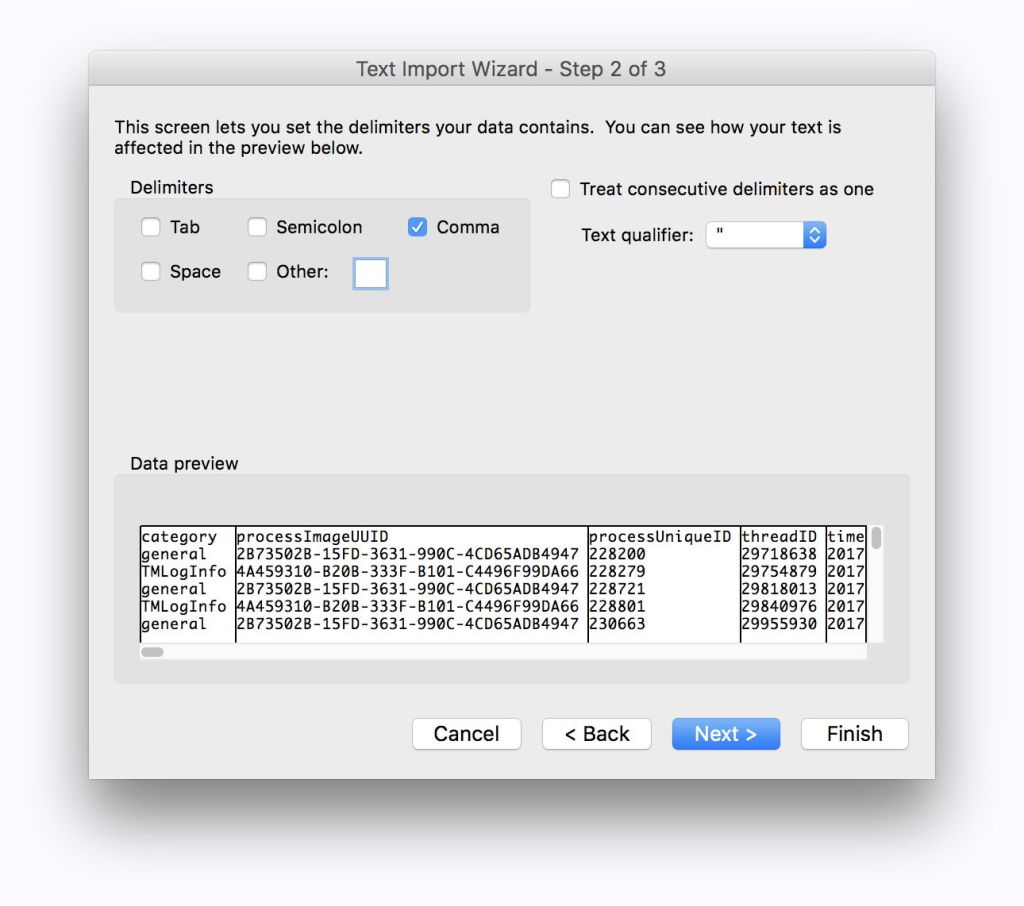
Once your CSV file is properly edited, you can then open it using Numbers, or import it as CSV into Microsoft Excel.

Excel’s import ‘Wizard’ offers good defaults most of the way, but you should not let it use Tabs as delimiters, only Commas.
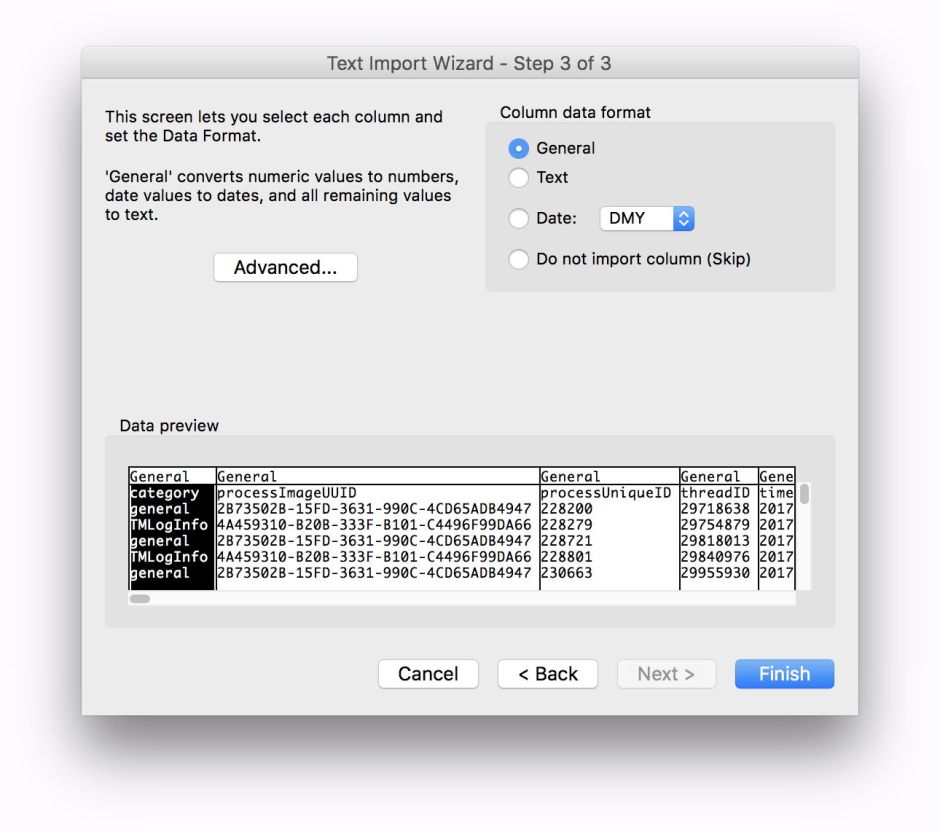
Oddly, the Data Preview feature does not work properly in the current version of Excel, but seems better in Excel 2011 (14.7.1). As the data stand, the datestamps are not suitable for conversion to times here, although it may be possible to massage them using R’s facilities.
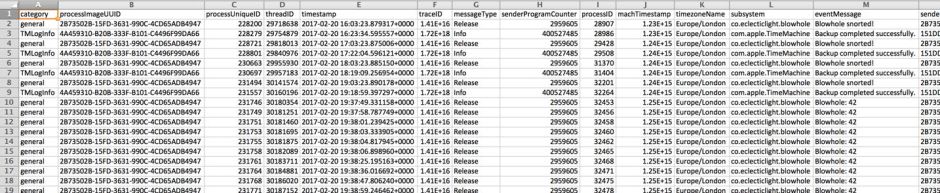
You should then end up with this incredibly detailed insight into those log entries, which even have their Mach timestamps, taken straight from the hardware tick count, and the current time zone.
As I refine and improve this process, I will post updates, but this should enable anyone wishing to do more with their log extracts to get started at last.
