
When something goes wrong with your Mac, the best clues are usually found in the log. Are you scared to open Console, or panic when you scroll through its contents?
Much may be hidden behind OS X’s friendly Finder and other front-end refinements, but when you need to trace and diagnose a problem, you should turn to Console and the riches of its logs. Whether it is an application that keeps unexpectedly quitting, or bouts of the spinning beachball, many mysteries can be solved when you spend a little time browsing contemporaneous log entries.
However if you just open Console and expect it to point helpfully at the entry that reveals all, you will be disappointed. You need to know how to navigate its apparently endless stream of text, and how to spot suspect entries.
Layout
With the lefthand list selected to show All Messages, the main window area will display warnings, comments, errors, and all manner of material. Every entry bears a date and time stamp at the start of the line, which is your first and primary means of knowing where you are in your Mac’s recent history. Landmarks of interest, and excellent points of orientation, are hourly backups made by Time Machine, and startup (or restart).
Immediately after the timestamp, each log entry contains the name of the process writing the output: in the case of backups, that is com.apple.backupd, and the process number in square brackets. This conveniently records the start and completion of each backup session.
Startup Landmarks

System shutdown, including that prior to a restart, is marked by the shutdown process and SHUTDOWN_TIME. Conversely startup (or restart) begins with the BOOT_TIME, following which the kernel logs its version details, Yosemite currently being 14.1.0.

You can then trace initialisation of virtual memory (vm_page_bootstrap), mounting of the startup disk (Got boot device then mounting as hfs), and a plethora of services and other initialisations by com.apple.launchd. Eventually WindowServer is launched to handle the graphical front-end, and user services appear thanks to com.apple.launchd.peruser.501.

Most background services, or daemons, have cryptic process names ending in the letter d, although a notable exception is the crawler that compiles metadata for Spotlight, which is named mdworker. Frequent errors or crashes in mdworker can slow systems down visibly, and the resulting error messages should identify which file or folder is causing the trouble, so that you can deal with it; deletion of the offending object is usually curative.
Warnings and Errors
Many apps log minor complaints and other largely irrelevant material, but an unexpected quit is usually marked by a couple of entries (at least) in which the dying app gives a clue as to why it has suddenly broken. Frequent error messages from apps can be innocent, but often merit careful investigation, to see if there is a fixed update or something else that you can address. Errors from the kernel are even more worrying, and suggest serious disarray or trouble in the /System/Library folder.
Check carefully through the processes started up by launchd after a restart. You may be surprised to see trial versions of cleaning or security products which you thought that you had erased. Some can be very fiddly to uninstall completely, and could leave a long-outdated daemon making the whole of OS X unstable.
Crash Reports
CrashReporter and Diagnostic reports are generally less helpful to users trying to diagnose software problems, and of much greater value to the application developer. This is because they list the process call chains at the time that an app or service crashes, which offer even expert users few clues as to what happened.
When apps do quit unexpectedly, accept the invitation to send that debug information to the developer so that they know what went wrong. Log excerpts are also valuable evidence when you send questions to me here, or anyone else trying to help you.
Supplementary Tool: Activity Monitor
Normally the tool of choice when chasing performance issues, Activity Monitor is even better when used with the information that you glean from logs. Its features had remained static before Mavericks, but its latest incarnation, version 10.10, is a big improvement in many respects.
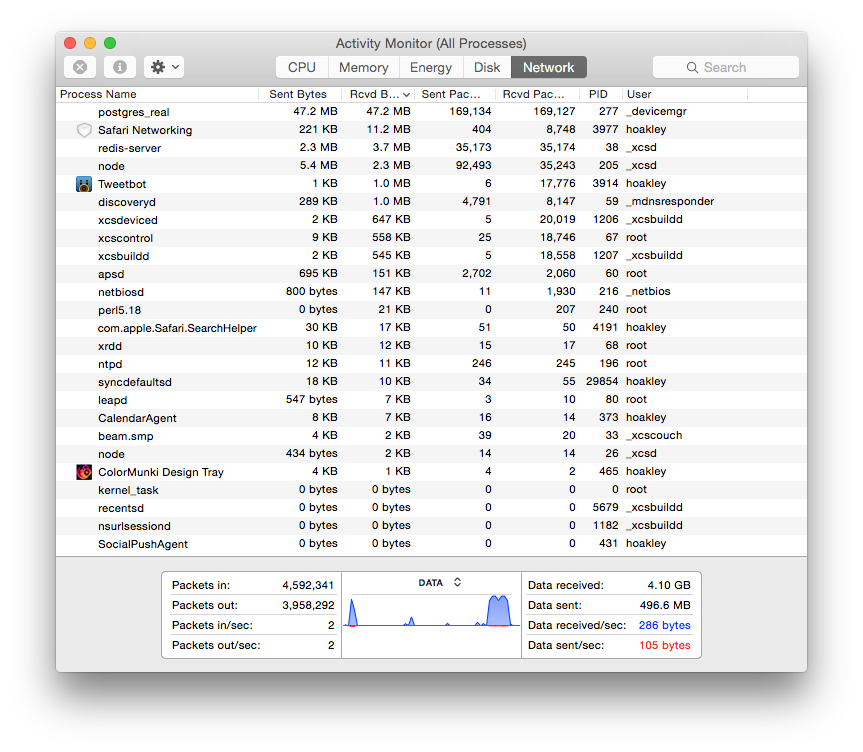
Click on any of the tabs except for Energy (probably the least useful addition), then on the PID column header to order listed processes by their process ID, the same given in the logs. You can now follow individual processes, watching the load that they place on the CPU, memory use, disk access, and network transfers, as they write warnings, errors, and other messages to the logs.
If an app is periodically writing a cryptic error message about being unable to open a file buried deep in Library folders, you can now see how much load that is placing on the CPU. You can watch another app as it ‘phones home’ over your network, and perhaps hangs waiting for the request to time out.
Processes which do not appear to be using the CPU much can sometimes be very active over your network. Activity Monitor lets you monitor vital signs, rather than using Console alone for post mortems.
Updated from the original, which was first published in MacUser volume 30 issue 02, 2014.
